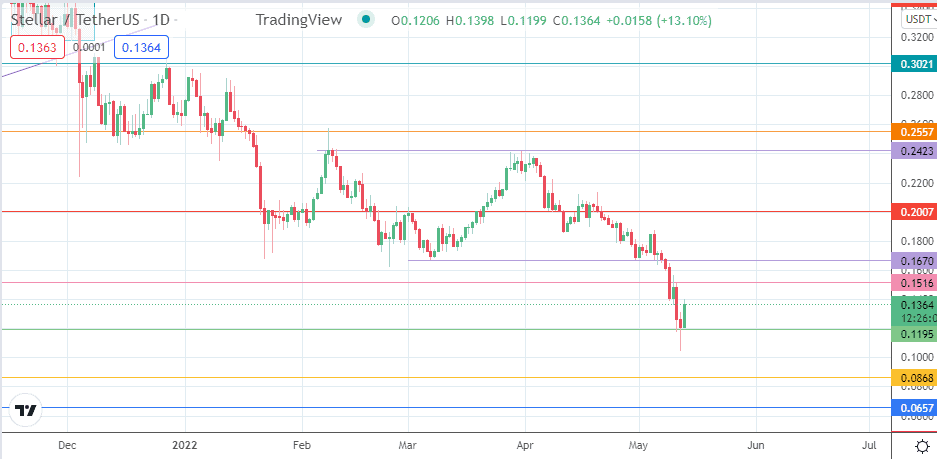
- Any recovery based on bullish Stellar Lumens price predictions will have to rely on a break of the 0.1516 resistance.
Despite the day’s uptick, the Stellar Lumens price prediction remains bearish along with the rest of the market. This is the second winning session in five for the XLM/USDT pair but has done little to erase the losses the token has suffered this week. This week’s losses stand at 15.47%, mostly due to the recovery move seen on the day. But the pair remains on course to post its 5th consecutive weekly loss.
This is the worst run of form for Stellar Lumen since the weekly close of 13 December 2021, which was the last time the XLM/USDT pair suffered five consecutive weekly losses.
Technically speaking, the formation of a hammer by Thursday’s daily candle on the 0.1195 support has allowed for a bounce on the day. This has led to the XLM/USDT pair gaining 12.6% on the day. A stronger push to the upside that sends the weekly candle’s closing price above 0.1516 would make a good case for recovery and boost bullish Stellar Lumens price predictions. So what is the Stellar Lumens price prediction for the weekend?

Stellar Lumens Price Prediction
The bounce on the 0.1195 support allows for a potential push towards the 12 December 2020 low at 0.1516. The bulls need to clear this resistance and an additional resistance at the 0.2007 price mark (21 June 2021/20 July 2021 low and 4 March 2022 high) for the bullish reversal to gain momentum.
If the advance gains momentum to transcend the 0.2557 resistance (8 February 2022 high), rally-sell opportunities may dry up. This would also open the door for an additional advance towards the 0.3021 price mark (23 September 2021/29 December 2021 highs).
When the support at 0.1195 gives way, a further slide in the XLM/USDT pair will be realised. This decline will immediately target the 0.0868 support mark (15 February 2020 high and 1 August 2020 low).
If the bulls fail to defend this support, the price action will attempt to find a floor at a lower target. 0.0657 is the next pivot in line, being the site of previous lows of 25 May 2020/23 September 2020. Additional support at 0.0437 (1 January and 15 April 2020) comes into the picture if the price activity fails to find a floor at 0.0657.
XLM/USDT: Daily Chart