The Robinhood share price surged on Monday after the company said it would settle a class-action lawsuit against it for outages in its app dating back to 2020. Robinhood was about to face a class-action lawsuit filed by aggrieved investors, who claim that a 2020 outage in its trading app caused investors to lose their funds while trading in a period of pandemic-related volatility.
The app saw an increase in trade volumes as retail investors seeking to profit from the market volatility that the COVID-19 pandemic generated poured onto the platform. Robinhood was at the centre of the controversy between the WallStreetBets retail investors and the hedge funds who were short GameStop and AMC Entertainment stocks.
The outages in question occurred on three days between 2 March 2020 and 9 March 2020. On one of such days, the Dow Jones Industrial Average saw its biggest daily point gain in history. Robinhood was fined by the US Securities and Exchange Commission (SEC) for the outages and for providing misleading communication.
The lawsuit argues that the outages caused the investors loss of potential revenue. Technically speaking, the emerging head and shoulders pattern could hold the key to the short-term price action.
Robinhood Share Price Forecast
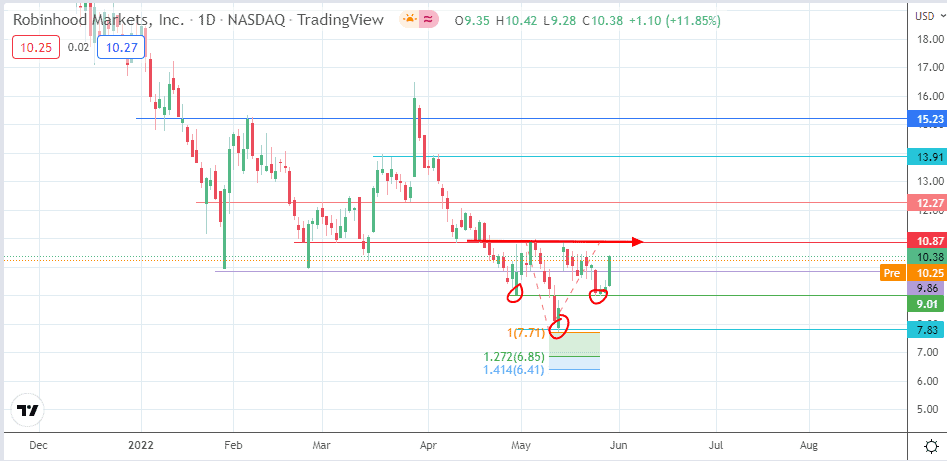
On Monday, the advance of the stock took out the resistance at the 9.86 price mark. This has cleared the path toward 10.87 (5 May high and neckline), which stands as the barrier that must give way to complete the inverse head and shoulders pattern. If the bulls clear this price hurdle, the next available target comes in at 12.27 (25 March low). 13.91 (22 March low) and 15.23 are additional northbound targets.
On the flip side, the bears would be hoping for a decline below the 9.01 price mark (25 May low), targeting 7.83 as the initial downside target. Below this level, new lows will emerge at the Fibonacci extension levels, with the 127.2% and 141.4% levels at 6.85 and 6.41 serving as additional targets to the south.
HOOD: Daily Chart