
Bullish MBOX price predictions following the formation of a double bottom on the daily chart have been fulfilled, as the price bar broke the neckline to confirm the pattern. However, the breakout move appears to be hitting its end-point, or at least a potential pitstop at a resistance zone formed by previous shadows of the 26-30 August price candles.
MBOX has seen a meteoric rise after clearing the range where the 5.099 resistance served as the ceiling. Following the retracement of the breakout move of 18 November, a double pullback and test of 5.907 set up the double bottom pattern, which was confirmed by Tuesday’s 31.33% surge.
Here is the MBOX price prediction, given according to the price picture on the daily chart.
MBOX Price Prediction
The double bottom on the daily chart, whose troughs are at the 5.907 support, may see its measured move completed at the resistance zone whose floor is at the 10.00 price mark. This follows the neckline break at the 8.246 resistance mark by the bounce that stemmed from the support at 7.438. A break of this resistance zone between 10.00 and 10.92 sets up a new record high for MBOX.
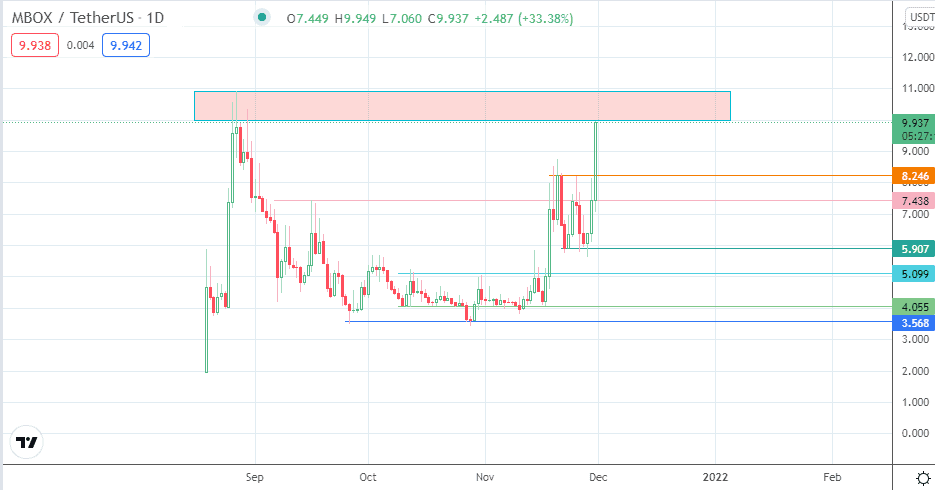
Conversely, rejection and a pullback from the resistance zone’s floor allows for a retest of the 8.246 price mark, now functioning as a support. A breakdown of this price point brings 7.438 back into the picture, with the 5.907 and 5.099 pivots acting as additional price support.
MBOX: Daily Chart
Follow Eno on Twitter.