
- The FTSE 100 Index has wiped out all of its gains generated earlier in 2026
- BP and Shell account for about 12%-14% of the Index, meaning the recent oil price rally is not enough to offset losses in other sectors
- US President Donald Trump said on Monday that the US was negotiating with Iran, suspending the threat of attacks against energy infrastructure
Since the start of March 2026, the FTSE 100 has been clearly going down, and it looks like the downward momentum will stay in place for a while. The index has dropped back below the 10,000 mark, which is a psychologically important threshold. Simultaneously, the index has wiped out most of its gains from earlier in 2026.
While it is often assumed that energy-heavy indices like the FTSE 100 would benefit from rising oil prices, a closer look reveals that concerns about reduced demand and inflation-driven expectations of interest rate hikes are overshadowing these positive effects.
Why the Steep Losses Despite Oil’s Surge?
Shell and BP make up about 12–14% of the index’s market value. The Footsie should be pretty safe if the price of Brent crude goes over $100. One detailed analysis on BBN Times rightly pointed out that the combined weight of Shell and BP means that a 0.4% drop in both companies at the same time would take away about 50–55 basis points of potential index performance. Conversely, gains from rising oil prices through these companies have limited ability to offset declines across the rest of the index.
However, the market is currently grappling with two more powerful forces, which are stagflation fears and interest rate volatility.
The market is currently contending with stagflation concerns and volatile interest rate, largely driven by geopolitical tensions impacting global energy markets and the overall economic outlook. Losses in sectors like banking, airlines, mining, and consumer goods far outweigh the partial support from energy stocks, which together dominate the FTSE 100.
This challenges the idea that exposure to energy alone can shield the index. Additionally, the FTSE’s significant exposure to financials and consumer-focused companies has contributed further downside pressure as investors move away from riskier assets. Inflation shocks alongside weaker global trade are combining to weigh on the index’s broader performance.
FTSE vs. Peers
The FTSE 100’s decline into correction territory has been more painful than many of its peers. Although Wall Street and Tokyo wrestled with the same global turbulence last week, U.S. tech strength helped soften blows there. March began with the Dow off about 7% from peak levels. Across the Atlantic in Europe, London’s index erased every gain built since early 2026 within just days. Tokyo found support through currency shifts, with yen weakness lifting export profits. Meanwhile, the sterling pound remains volatile against the dollar.

Things got worse when the Bank of England met on March 19. Though Monetary Policy Committee member backed keeping interest rates steady at 3.75%, they lifted their outlook for consumer price inflation sharply. Now they see it topping 3% through most of 2026, which is way beyond the earlier 2.1%.
Afterward, Governor Bailey noted officials are prepared to step in if needed, while confirming the committee sees higher borrowing costs as a necessary tool against persistent inflation pressures.
However, US President Donald Trump’s surprise statement on Monday indicating progress in negotiations between the United States and Iran, will likely cool down investors nerve this week. The FTSE 100 Index started the day in the red but was up by 0.56% at press time during the European session after Trump stated via his Truth Social account that the earlier threat of attacks against Iran’s energy infrastructure had been suspended for at least five days.
FTSE 100 Index Forecast
The FTSE 100 index has broken below its 50-day and 100-day Simple Moving Averages (SMA), with immediate support now sitting at the 9,860 level. The expanding MACD histogram indicates continuing downward momentum, suggesting that a breach of this support could lead to a drop toward YTD lows of 9,681. Resistance levels to watch are the psychological 10,000 mark and then 10,082, aligning to the current 100-day SMA.
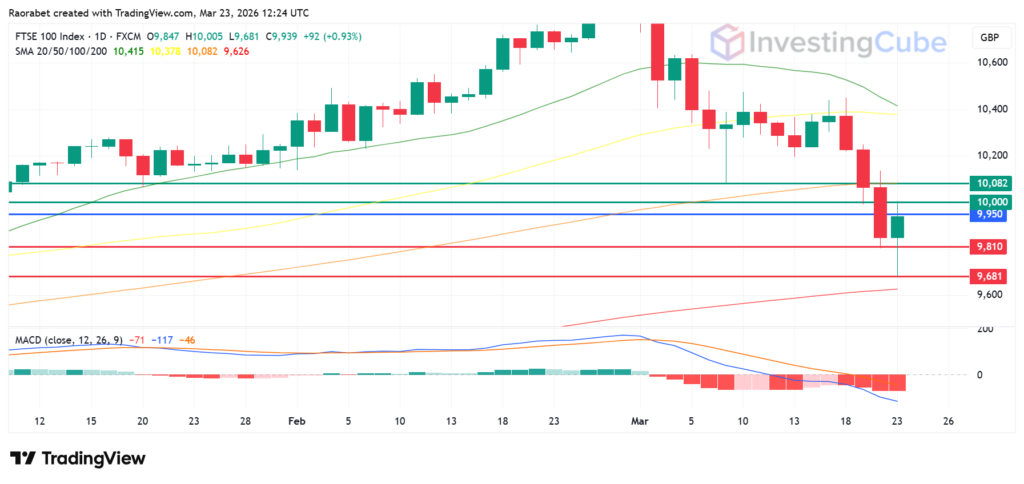
FTSE 100-day Index on the daily time frame with the key levels of resistance and support. Created on TradingView
Because Shell and BP together represent only 12–14% of the index. The other 86%, consisting of banks, miners, airlines, healthcare, and consumer goods are all hurt by higher energy costs, tighter monetary policy, and global recession fears.
The FTSE has been an underperformer, wiping out all 2026 gains. While the Dow is in a medium-term downtrend, the FTSE’s commodity sensitivity and the UK’s soaring borrowing costs have made it more vulnerable to the Middle East crisis.
It has completely flipped the narrative. Before, markets thought there would be rate cuts, but now, because of the inflation shock caused by rising energy prices, analysts are warning of up to four rate hikes in 2026. This has made investors very unhappy.
