Hedera Hashgraph price has been in a tight range in the past few days as cryptocurrencies waver. HBAR was trading at $0.063 on Friday morning, where it has been in the past few days. This price is about 88% below its all-time high, giving it a market cap of over $1.4 billion.
Hedera waiting for a catalyst
Hedera Hashgraph is a leading blockchain project that aims to be a better alternative to other smart contract platforms like Ethereum and Solana. It is 10x times faster, carbon negative, and has an ever-predictable gas fee. It can handle over 10,000 transactions per second (tps) and the average gas fee is about $0.0001.
Most importantly, it has affiliations with some of the biggest companies in the world, which act as its owners and validators. Some of these companies are London Stock Exchange (LSE), Nomura, Ubisoft, IBM, Google, and Boeing.
Hedera Hashgraph price has been under pressure in the past few weeks as investors wait for the next catalyst. This price action has been in line with that of other cryptocurrencies like ETH, Cardano, and Solana.
Some of the top things that will likely impact HBAR price are the American monetary policy and the upcoming Ethereum merge. The Fed has maintained an extremely hawkish view as evidenced by last week’s speech by Jerome Powell at the Jackson Hole Symposium. As a result, investors will watch the latest non-farm payrolls data scheduled on Friday.
Ethereum merge, which will start happening next week, will have an impact on HBAR and other cryptocurrency prices. Meanwhile, Hedera’s growing ecosystem is also a notable thing to watch. According to DeFi Llama, Hedera’s total value locked (TVL) has jumped from nil to over $14 million in less than a month.
Hedera Hashgraph prediction
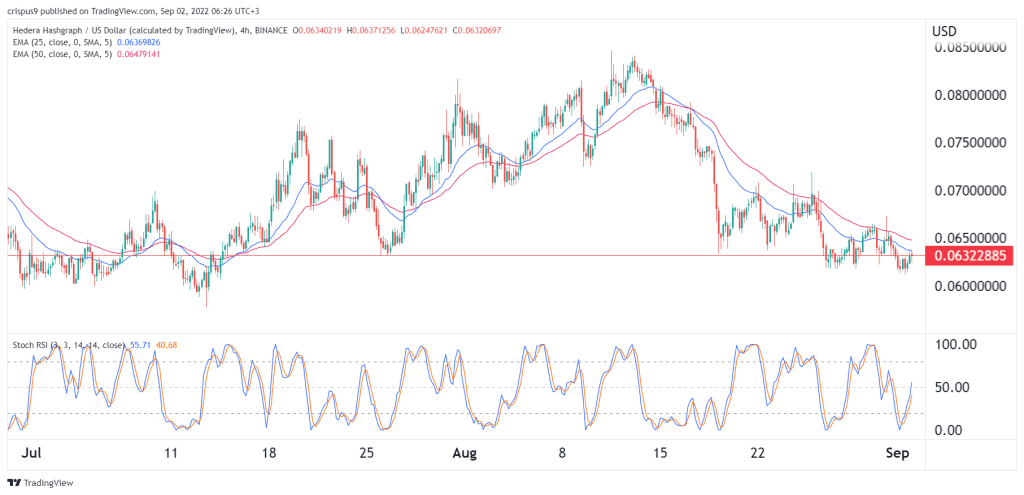
The four-hour chart shows that the HBAR price has been in a downward trend in the past few weeks. Precisely, it has fallen by about 25% from its highest point in August. It has also moved slightly below the 25-day and 50-day moving averages while the stochastic RSI has moved slightly above the oversold level. Additionally, it has formed a head and shoulders pattern.
Therefore, Hedera price will likely continue falling as sellers target the next key support level at $0.005. A move above the resistance level at $0.065 will invalidate the bearish view.