Today’s trading session is showing signs that Hedera Hashgraph prices may be dropping. This is despite the last two days showing a strong bullish move. Today’s drop in prices may be a continuation of the long bearish trend that started last year.
The drop may also be a result of the drastic drop in the trading volume of the cryptocurrency compared to the previous day. In the last 24 hours, the trading volume has decreased by 15 per cent. This means that about $54.8 million worth of Hedera Hashgraph has been bought or sold during that period. Such a drastic drop may translate to market losses, which can explain Hedera’s current drop in prices.
Hedera Hashgraph Price Prediction
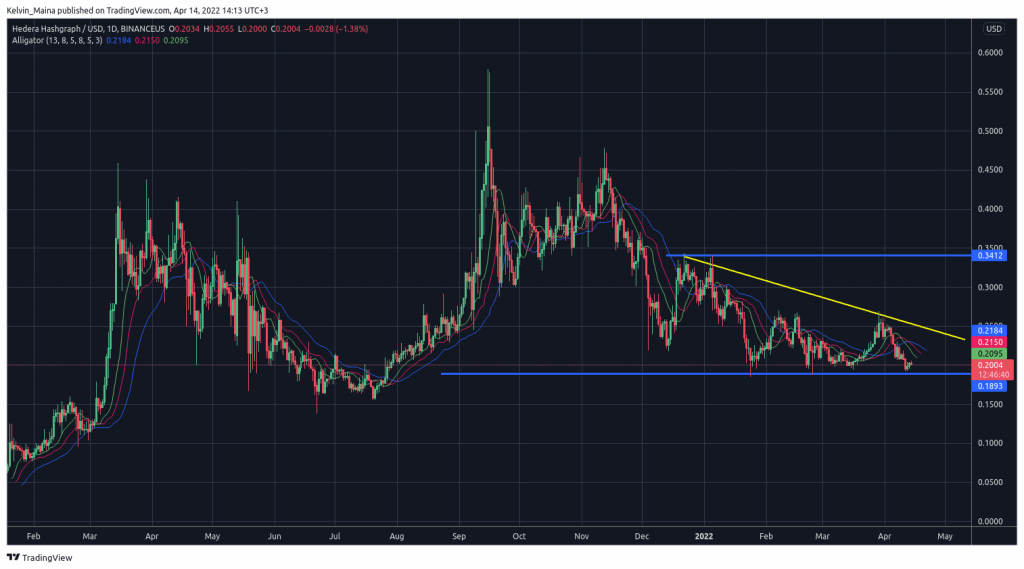
The Hedera Hashgraph prices have been trading in a downward trend for months. Looking at the daily chart below, we can see the prices started trading within a descending flat on December 8, 2021. Since then, the cryptocurrency has lost over 40 per cent of its value. The month of April has also been very bearish, with Hedera Hashgraph prices losing over 20 per cent.
Looking at the daily chart below, we can see that the descending flat trading is almost coming to an end. This means that a breakout is imminent. Normally, when prices of a descending flat breakout, the prices mostly move downwards. Therefore, using the chart, we can see a possible downward trend in the Hedera Hashgraph.
There is also a high likelihood of the prices hitting the $0.18 support level and breaking to the downside. When that happens, we should expect the prices to drop further, with a possible price of below $0.17 possible in the coming days. The likelihood of a strong bearish move is also shown by the Williams Alligator, which has been showing increased downside volatility in the past few days.
However, after the prices hit the $0.18 support level, there is a bullish likelihood, though minimal. This is because a descending flat does not always equal a strong bearish move. If that happens, then my trade analysis will be invalidated, and the prices may bounce from the support level and trade upwards.
HBAR Daily Chart