Fantom has traded sideways for more than three weeks. Although at some point, the crypto has shown signs of recovery from its May price drops, the crypto has failed to break past $45 and reverse the long-term trend.
Why is Fantom Price trading
On the week that Terra Luna and UST projects fell, Fantom prices went down by 54 per cent. The three-day rout in the markets left a huge dent that Fantom has not been able to recover since then. The aggressive drop also saw the crypto closing the month of May 40 per cent below its opening price.
Unfortunately, the Fantom strong bearish trend of May looks to have been carried on to this month. Fantom is already down by 14 per cent. The trend also looks aggressive enough, and there is a high likelihood of a further drop in the price of the Fantom cryptocurrency.
Since the year started, Fantom has also posted consecutive monthly price drops. This has seen it drop by more than 84 per cent since the year started. In addition, fantom price has also dropped by 90 per cent from its 2022 price highs.
Fantom Price Prediction
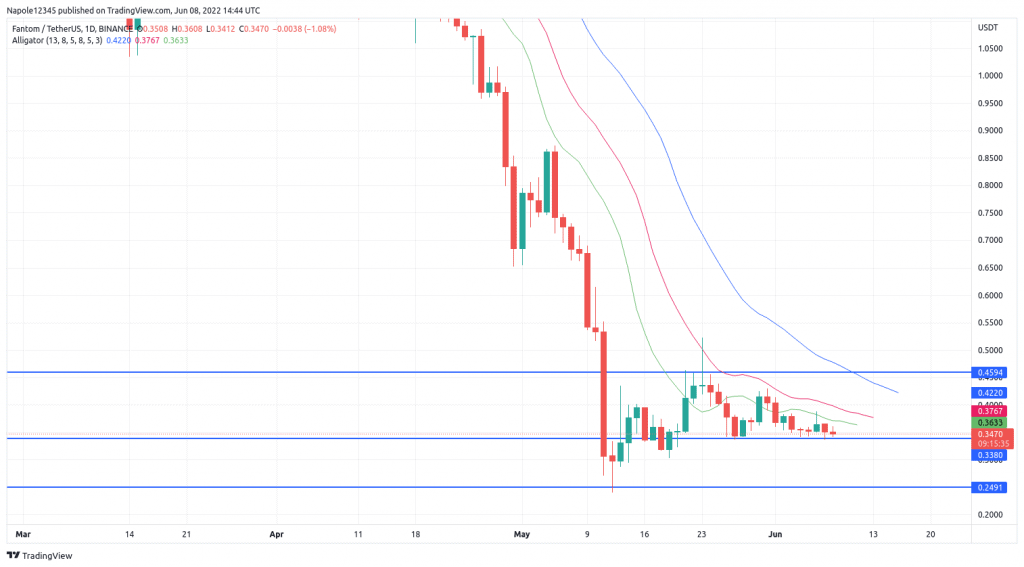
The chart below shows Fantom price is down by a percentage point in today’s trading session. The chart also shows today’s drop will mark a second consecutive day where prices are losing in the markets. Using the chart, we can see the prices have failed to break out of the $0.33 and $0.45 support and resistance levels, respectively.
Instead, prices have traded in a sideways market for the past three weeks. Furthermore, my Fantom price analysis using price action of the past few days also shows the prices are likely to continue trading sideways. Therefore, we will likely not see the prices breaking out of the current support and resistance market structure for the next few trading sessions.
However, if the prices trade below $0.33 or above $0.45, then my sideways market analysis will be invalidated. It will also mean the start of a bear market if prices go below the $0.33 price level or a bull market if the prices trade above the $0.45 resistance level.
Fantom Daily Chart