Dogelon Mars has been trending downwards since February 9, 2022. Today, the crypto has lost 16 per cent of its value and marks the second consecutive day that Dogelon Mars prices are going down.
Dogelon Mars Fundamental Analysis
A quick glance at the Dogelon Mars name, and it is not hard to see the combination of Doge and Elon in its naming. This is because Dogelon Mars is a meme coin that was forked from Dogecoin. The coin also has a ticker symbol of Elon, further cementing association with the Tesla founder. The naming was done specifically to capture the attention of meme coin enthusiasts.
Like other meme coins, Dogelon has no use case. Instead, it relies on backing from enthusiasts who push the prices up every time they purchase the crypto. Unfortunately for Dogelon Mars, Elon Musk is yet to endorse the crypto desire association with the crypto. Dogelon Mars has a market value of $359 million and is currently ranked as the 133rd most valuable crypto in existence.
The future price of Dogelon will be affected by the number of listing in exchanges it receives in the coming weeks or months. The endorsement of public figures such as Elon Musk, whose name is heavily linked with the project, will also affect the prices.
Dogelon Mars Price Prediction
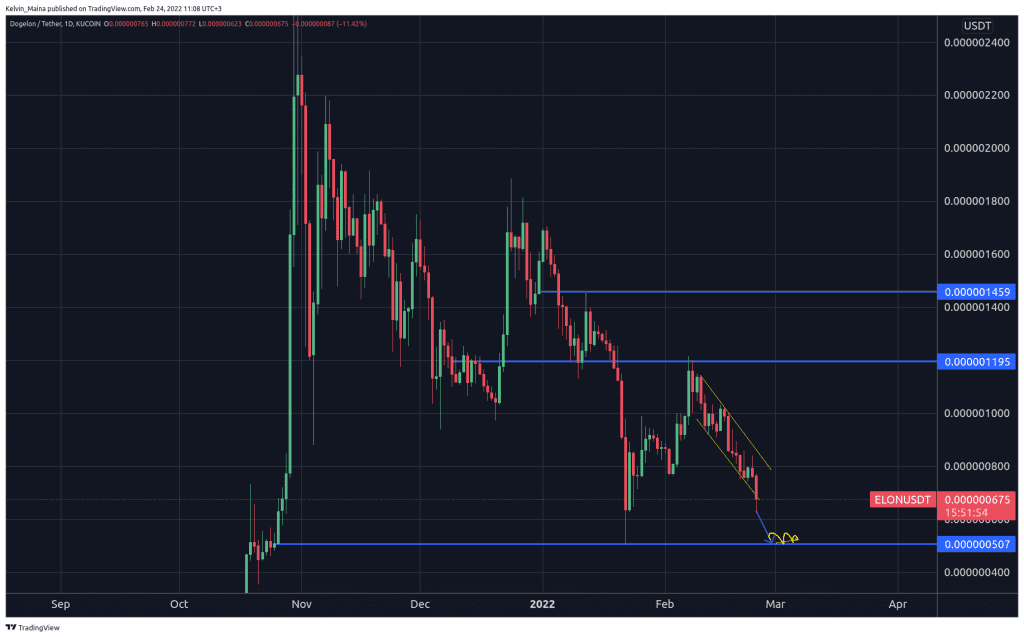
Dogelon Mars prices are currently trading at $0.00000067. The crypto opened the markets trading at $0.00000077 and has dropped 16 per cent in today’s trading session. Looking at the daily price chart, Dogelon coin prices are trending within a descending channel since February. However, in today’s trading session, the prices have broken the descending channel and are currently trading below the channel’s lower trendline.
The prices have also been trading within a larger trading structure of support and resistance levels. Using the daily chart price action analysis, I expect the prices to continue with their downward push until they hit the $0.00000050 support level. The prices will likely trade sideways at this level as the support level is retested.
This will present two scenarios, one is there is a possibility that the prices will break the support levels to the downside, marking a continuation of a bearish move. The second possibility is a reversal after hitting the support levels, which will mark the start of a bullish move. However, if the prices reverse and move back inside the descending channel, then my trade will be invalidated. It will mean that the prices are likely to move upward.
Dogelon Mars Daily Price Chart