
- The FTSE 100 Index remains relatively resilient, supported by rising oil prices and strength in energy and commodity stocks.
- In contrast, the FTSE 250 Index is under pressure due to higher borrowing costs and domestic economic concerns, leading to a clear bearish shift.
The FTSE 100 index surges by 97.93 points or 0.97%, as of today at 13:43 GMT+2. The biggest driver of this surge is Middle East tensions. Since there are no signals of de-escalation of the war between Iran and Israel, it has dominated market sentiment. Therefore, the market faces sharp volatility, with both indices falling earlier due to uncertainty, then rebounding on energy gains. As the FTSE 100 is an energy-heavy index, this positively drives it.
Oil prices surged above $110-$115 amid fears of supply disruptions. This lifted oil majors and mining stocks, pushing the FTSE 100 higher. The FTSE 100 outperforms because it’s heavy in BP, Shell, and miners; on the other hand, the FTSE 250 lags due to less exposure to commodities.
The FTSE 100 is supported by global commodities, especially the surge in oil prices, and also by the strength of the USD. Since the FTSE 250 is more exposed to the UK domestic market, it has weaker performance. That’s why during multiple sessions, the FTSE 100 gained while the FTSE 250 fell or underperformed.
From a fundamental perspective, the Bank of England kept rates unchanged but warned about inflation risks due to the oil shock. Therefore, markets now fear higher-for-longer rates. This caused more downward pressure on equities, especially the FTSE 250, which is heavily exposed to the UK market. This reflects how higher borrowing costs weigh on a stock’s growth.
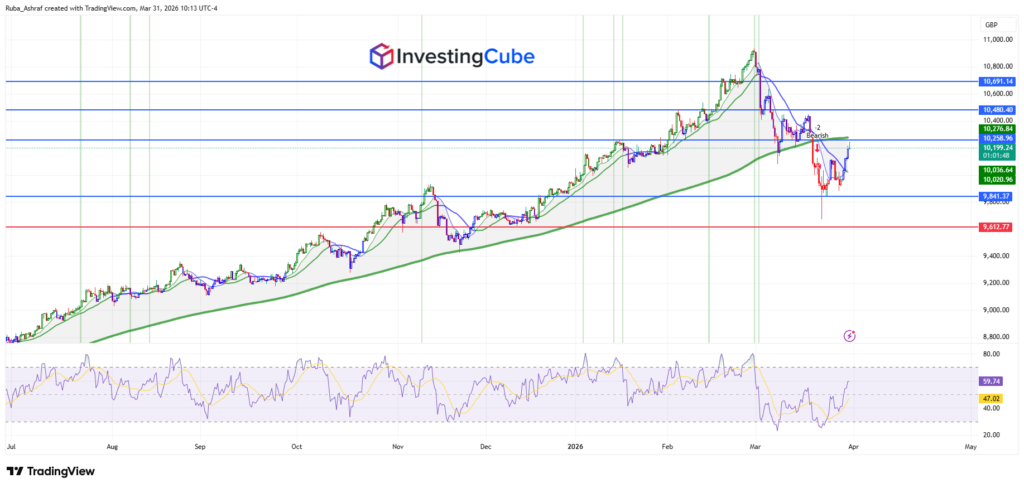
The FTSE 100 Technical Outlook | Key Levels to Watch:
The price action of the FTSE 100 Index shows a strong and steady uptrend over the past few months. The market formed higher highs and higher lows. Prices remained consistently above the long-term moving average (green line).
However, after reaching a peak near 10,800-10,900, the index faced a sharp bearish correction, breaking both the short-term and long-term moving averages below. This decline pushed toward the 9,800-10,000 support zone, where strong buying interest emerged.
From a level’s perspective:
- Immediate resistance is seen around 10,250-10,300, followed by 10,480, and then the major barrier near 10,690.
- On the downside, key support lies at 10,000, with a stronger floor near 9,840 and a deeper level around 9,600.
Although the recent bearish structure during the pullback, the current recovery suggests that this bearish phase may be weakening as momentum shifts. Looking at the moving averages, the short-term average is still below the long-term one. This reflects recent weakness. However, the price is pushing higher toward these averages, and a sustained move above them would confirm trend reversal back to bullish.
The RSI is currently rising toward the 60 level, recovering from oversold territory. This indicates improving momentum with a possibility for further upside before reaching overbought conditions.
Overall, the index is in a recovery phase after a sharp correction, with buyers attempting to retain the long-term trend line. A sustained break and hold above the moving averages would strengthen the bullish outlook.

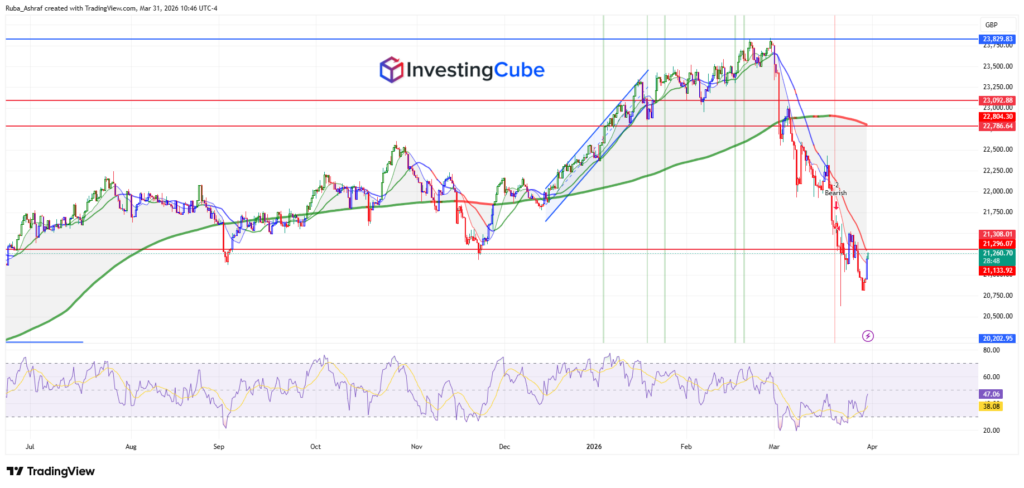
The FTSE 250 Turns Bearish After Breaking Key Support Levels:
The FTSE 250 index shows a significant shift from a bullish trend to a strong bearish correction, reflecting both technical breakdown and changing fundamentals.
Initially, the index was moving within a well-defined upward channel (blue trend lines), forming higher highs and higher lows while trading above the long-term moving average (green line). This confirmed a strong bullish structure supported by steady momentum.
After peaking near the 23,800 resistance area, the index experienced a sharp reversal, breaking below the ascending channel and key horizontal support levels around 23,000 and 22,800. This breakdown marked a transition into a bearish phase.
Looking at the moving averages, the price has now fallen below both short-term and long-term moving averages, indicating a loss of upward momentum and a shift in trend direction. The long-term moving average is also starting to flatten, indicating weakening bullish pressure.
Looking at key levels:
- Immediate resistance stands at 21,300–21,500, followed by stronger resistance near 22,800 and 23,000.
- On the downside, support is seen around 21,100, with a deeper level near 20,700, which acted as a recent low.
Importantly, this technical shift is supported by fundamental factors. The Bank of England’s decision to keep interest rates unchanged, combined with rising borrowing costs, has weighed heavily on growth-oriented and domestically focused stocks. This has pressured the FTSE 250 more than large-cap indices, contributing to the sharp decline.
The RSI dropped sharply into oversold territory during the sell-off and is now recovering toward the 45-50 range, signaling a temporary rebound but still weak momentum overall.
The FTSE 100 benefits from global exposure and gains in energy and mining stocks, while the FTSE 250 is more sensitive to UK economic conditions and higher interest rates.
Higher borrowing costs, following the Bank of England policy stance, are weighing on growth and mid-cap companies, putting downward pressure on the index.