The Bitcoin price crashed to an important support level on Thursday morning as investors reflected on the latest FOMC minutes. BTC is trading at $43,110, which is the lowest it has been since December 5th. It has fallen by more than 30% from its highest level on record.
The biggest reason why the BTC price has crashed lately is that investors are no longer fighting the Fed. In its December meeting, the Fed warned that it will implement three rate hikes in 2022. Before that meeting, the Fed had hinted that it will start hiking in 2023.
The FOMC published its minutes on Wednesday and investors freaked out. They dumped cryptocurrencies, pushing their market capitalization to about $2 trillion. They also dumped high-growth stocks, leading to a 500 point decline of the Nasdaq 100 index.
Historically, risky assets like cryptocurrencies and high-growth stocks tend to fall in a hawkish environment. This explains why they did well when the Fed lowered rates and then implemented an open-ended quantitative easing policy.
Bitcoin price analysis
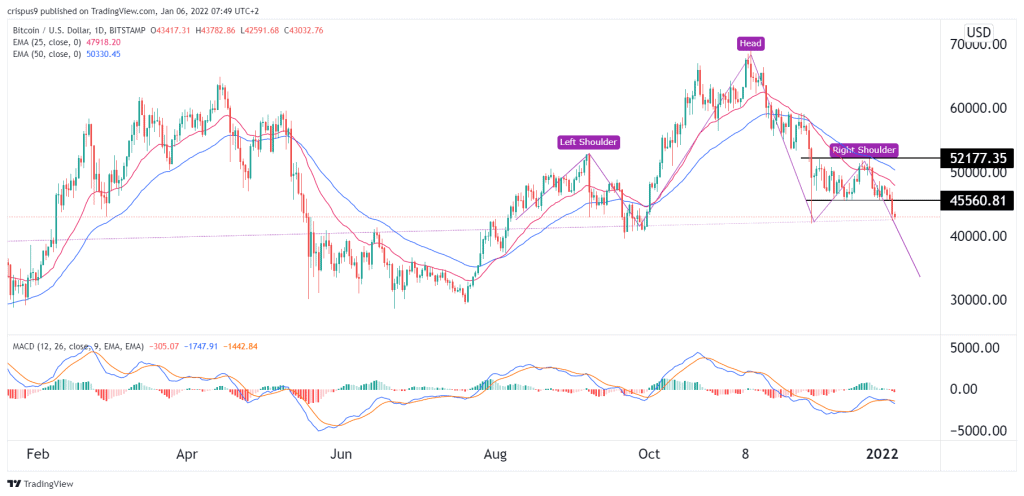
The daily chart shows that the Bitcoin price has been in a strong bearish trend in the past few weeks. A closer look at the chart shows that it has formed a head and shoulders pattern. Indeed, it is currently trading at the neckline of this pattern. It has also moved below the 25-day and 50-day moving averages.
Therefore, there is a possibility that the BTC price will keep falling in the near term. If this happens, the next key level to watch will be at $40,000.
Still, there is an alternative scenario since the coin seems to have formed a double-top pattern whose neckline is at $52,177. Therefore, while signs are that the coin will decline, a bullish comeback cannot be ruled out.