
The Audius price correction appears to have taken the steam of AUDIO/USDT price predictions. However, the minor uptrend on the daily chart remains intact. The 5.43% decline seen on Wednesday marks a general correction seen in the crypto market following last week’s surge. Audius was not left out of this surge, notching a 37.02% gain. This was the third straight weekly gain for the AUDIO/USDT pair.
However, this week appears to be when traders who got into the recent upsurge may want to bank some profits. The weekly chart (not shown) indicates that the weekly candle is has a long upper shadow, formed as the earlier gains of Sunday and Monday get wiped off by the selloff seen on Tuesday and Wednesday.
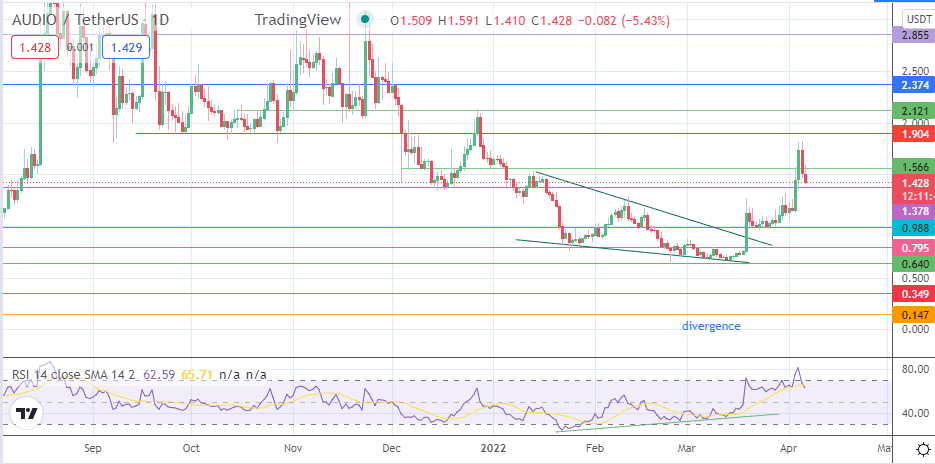
The market participants want to see whether the bulls can successfully defend the immediate support at 1.378, which will provide the basis for a renewed bullish Audius price predictions.
A potential bounce could present a new buying opportunity for aggressive traders. Conservative traders may wait for cheaper entry opportunities at lower-priced support levels. But, of course, there is always the potential for a massive selloff to hit the market, given recent moves by the European Union lawmakers to push for new tracing rules to detect the possible use of cryptos as sanction-dodging tools.
Audius Price Prediction
The upswing from 19 March followed the falling wedge and the RSI divergence identified on the daily chart of the AUDIO/USDT pair. The breakout move encountered hurdles at 0.988 and 1.378, which it took out easily. After completing the pattern’s measured move at the 1.843 resistance (7/25 December 2021 highs), the AUDIO/USDT pair is in correction mode.
This correction is expected to test the former resistance-turned-support at 1.378. If the corrective decline extends below this border, 0.988 becomes an additional target to the south. There is also the potential for 1.263 to form a pitstop on the way down. 0.795 (25 January low) is a downside target that is a bit far-fetched.
On the flip side, the bulls need to see a bounce that ultimately translates into a break of the 1.843 resistance. If this break is successful following a bounce off 1.378, 2.121 (15 October/27 December 2021 highs) becomes the target to beat further north. Above this level, 2.374 (30 October/2 December 2021 highs) and 2.855 appear as additional barriers that the bulls can use as harvest points for any long trades set following the break of 1.843.
AUDIO/USDT: Daily Chart
Follow Eno on Twitter.