The crypto market has staged a modest recovery in the last two days, which has helped stave off additional Algorand price predictions. But what is the Algorand price prediction heading into the last month of the second quarter?
The Algorand price predictions will continue to be dictated by the price patterns on the charts and the prevailing market sentiment. Unfortunately, the prevailing market sentiment remains negative and looks like it will stay that way for some time. This is because central banks are pumping interest rates, and the money market instruments that benefit from rate hikes compete for the crypto market’s investment flows.
With traders paying little attention to fundamental triggers, some of the events happening within the Algorand ecosystem may not produce too much of a bullish response. A look at the daily chart shows a retracement rally in progress. Short-sellers typically use these setups to initiate new short entries.
The critical price levels are the 0.4514 and 0.5097 price marks. These price resistance levels could determine if short sellers will prevail or if the bulls can push prices high enough to initiate a reversal of the prevailing downtrend. So here is the Algorand price prediction for the week.
Algorand Price Prediction
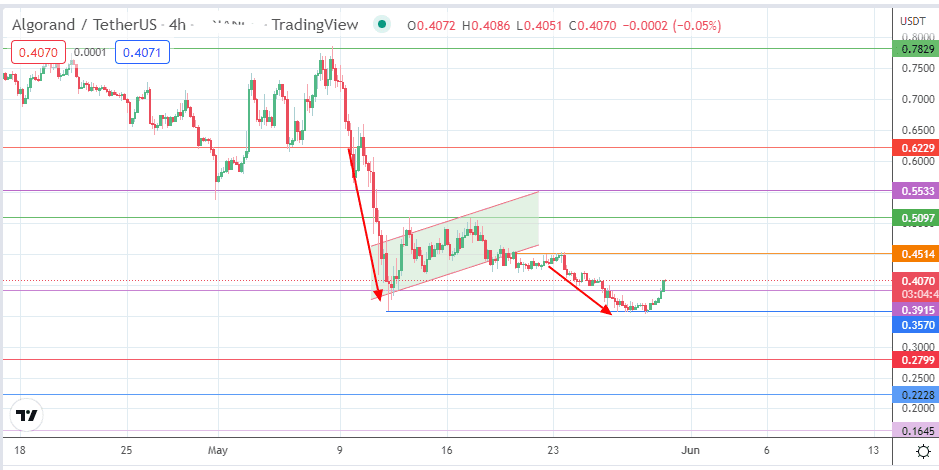
The bounce on the 0.3570 support level completes the measured move from the breakdown of the bearish flag. This bounce has overcome the resistance at 0.3915, opening the door to the 0.4514 barrier (23 May 2022 high). Above this level, 0.5097 (13/17 May highs) and 0.5533 (11 May high) are additional barriers to the north. The 29 April/5 May 2022 highs at 0.6229 complete the short-term targets to the north.
On the flip side, the bears would need to see a breakdown of the 0.3570 support for the price activity to aim for the 0.2799 support (27 November 2020 and 24 December 2020 lows). Further targets to the south reside at the 0.2228 price mark (4 November 2020 lows) and the 0.1645 pivot.
ALGO/USDT: Daily Chart