
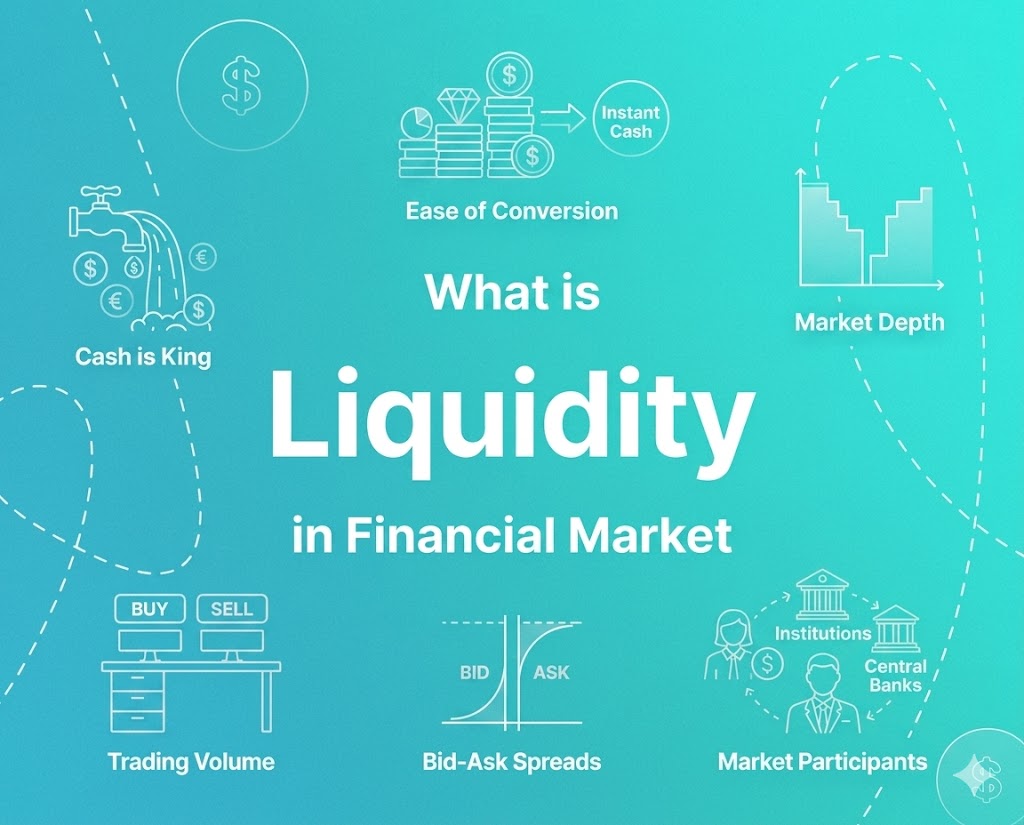
Liquidity is one of the most important forces shaping financial markets. It affects how quickly traders can enter or exit positions, how much they pay in trading costs, and how smoothly prices react to buying and selling pressure.
Whether trading forex, stocks, cryptocurrencies, indices, or commodities, understanding liquidity can improve trade timing, execution quality, and risk management.
In highly liquid markets, trades are filled rapidly with minimal disruption to price. In thin or illiquid markets, the same order may trigger sharp movements, wider spreads, or unexpected slippage. Because liquidity changes across sessions, asset classes, and market conditions, traders who understand how to identify and adapt to it often gain an operational advantage.
What is liquidity in trading?
Liquidity in trading refers to how easily an asset can be bought or sold without causing a major change in its market price. A market is considered highly liquid when:
- Many participants are actively trading
- Large orders can be absorbed efficiently
- Bid-ask spreads remain tight
- Trades execute quickly
Liquidity represents the market’s capacity to process buying and selling activity efficiently. Therefor, the higher the liquidity, the easier it becomes to trade near quoted prices.
What drives market liquidity?
Below, we will look at the three main factors affect market liquidity in trading. This include:
1. Order types and book dynamics
Orders entering the market are split into liquidity-providing or liquidity-consuming categories:
- Market orders: These consume existing liquidity. A market buy order immediately matches with and removes the lowest available sell limit orders resting in the order book.
- Limit orders: These provide liquidity. By placing a limit order to buy below the current market price, a trader adds structural depth to the book, giving future sellers an immediate counterparty.
- Stop orders: When triggered by price action, stop orders instantly convert into market orders. During high-impact news events, a cascade of triggered stop-losses can quickly drain available order book depth, leading to price gaps and slippage.
2. Market participation levels
The structural depth of a market depends on the volume of active institutional and retail counter-parties. When participation is high, large block orders are absorbed smoothly with minimal price disruption.
Conversely, participation routinely drops ahead of high-impact macroeconomic releases (such as CPI or central bank rate decisions) or during global bank holidays, resulting in thin, erratic price movements.
3. Market stress and uncertainty
Market stress, triggered by geopolitical uncertainty, economic shock or major news can lead to liquidity withdrawal.
- A general lack of confidence heightens volatility and can make trading more risky, especially when bid-ask spreads balloon and execution quality drops.
- In times of uncertainty, traders often reduce order size or stay out of the market, while market makers widen spreads to compensate for higher risk.
How is market liquidity generated?
Market depth does not appear automatically; it is generated by continuous interactions between distinct categories of financial participants, each operating with unique strategic goals.

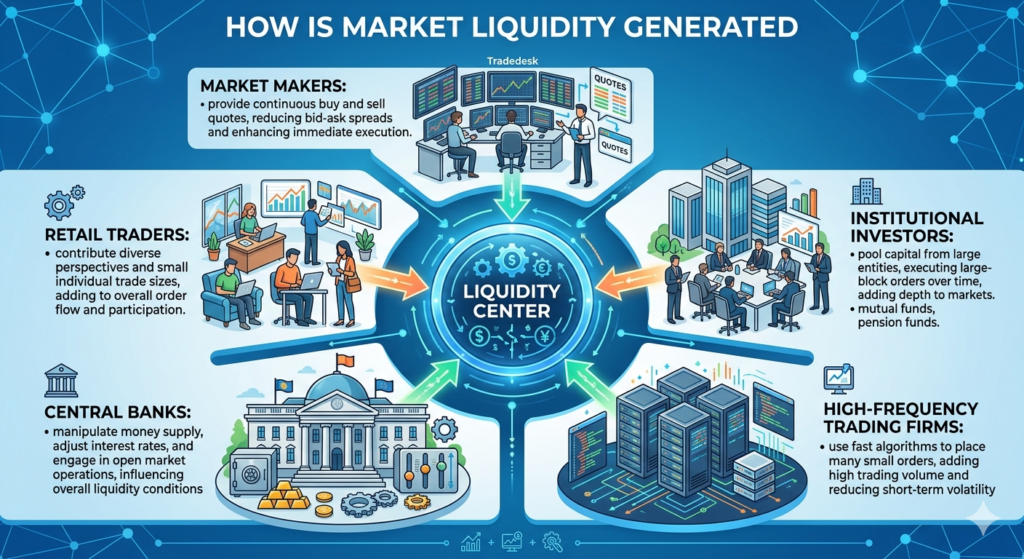
- Institutional market makers: Tier-one banks and massive brokerage firms generate the foundation of market liquidity by continuously quoting two-way buy and sell prices, pocketing the fractional bid-ask spread as compensation for taking on inventory risk.
- High-frequency trading (HFT) firms: Utilizing ultra-low latency algorithmic infrastructure, these proprietary trading firms enter and cancel thousands of orders a second, providing vital short-term depth to the market structure.
- Institutional investors: Asset managers, pension funds, and sovereign wealth funds inject massive structural volume into the markets. Because their positions are so large, they use sophisticated execution algorithms to split orders over time to prevent shifting the market price.
- Central banks: During periods of currency instability, central banks can directly intervene in open markets to inject or absorb massive pools of liquidity to stabilize their domestic currency.
- Retail traders: While individually small, the aggregate order flow from millions of global retail accounts creates a consistent stream of transactional volume across major retail brokerages.
When is market liquidity at its highest?
Liquidity is not static; it is heavily dependent on asset classification and specific clock hours. The daily dollar value traded varies significantly across different global asset classes:
| Asset class | Daily volume status | characteristics |
| Foreign exchange (Forex) | Highest ($7+ Trillion/day) | Deep, seamless 24/5 liquidity across major pairs (EUR/USD, USD/JPY). |
| Equities & indices | High to medium | Concentrated during primary exchange hours; small-caps remain structural exceptions. |
| Commodities | Medium (seasonal) | High depth in benchmark contracts (Crude oil, Gold) during specific trading windows. |
| Cryptocurrencies | Emerging (fragmented) | Deep liquidity for top-tier assets (BTC, ETH) but highly fragmented across global exchanges. |
What time of day has the most liquidity?
The absolute peak of market liquidity occurs during session overlaps. When two major financial hubs are open simultaneously, the duplication of active market participants drives spreads to their tightest annual averages.
The London–New York overlap (13:00 to 17:00 GMT) represents the most liquid window in the global financial system. During these four hours, the volume of matching institutional orders peaks, resulting in optimal order routing, near-zero slippage, and minimal structural execution costs.
Liquidity vs volatility
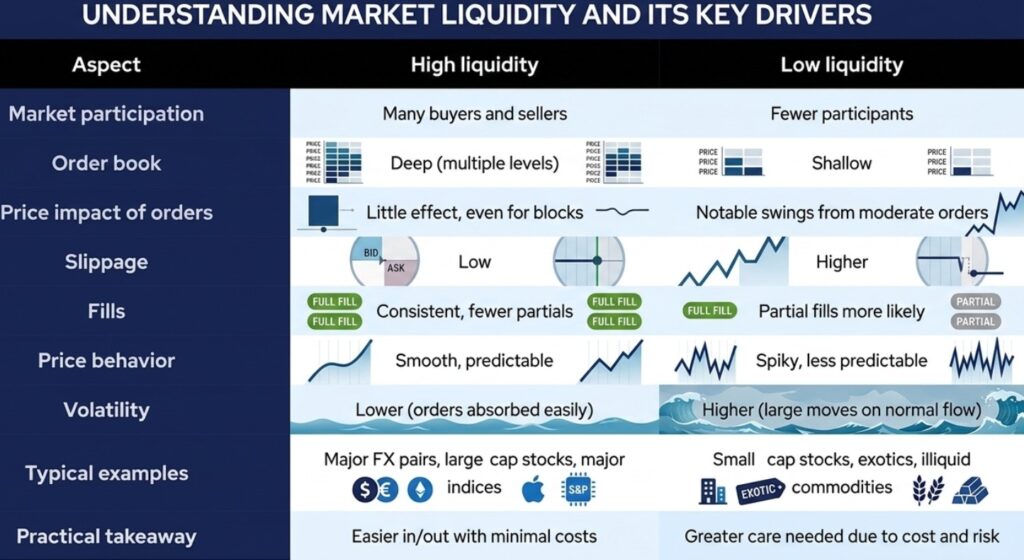
Liquidity and volatility share an explicit, inverse structural relationship. When liquidity is high, volatility tends to decrease; when liquidity dries up, volatility spikes aggressively.
- In highly liquid markets, prices move smoothly and with less volatility because orders are absorbed easily.
- When liquidity is thin, volatility is high and prices can swing dramatically, with large moves triggered by normal trading activity.

How does liquidity impact trading execution?
Liquidity does not just sit passively on a chart; it actively determines the financial outcome of every automated or manual strategy through four core operational channels.
1. Actual trading costs
Your true cost of doing business is directly tied to session liquidity.
- The spread: During high-volume periods, competitive quoting forces the bid-ask spread to its absolute floor. In thin markets, the spread widens to protect market makers, forcing you to start further in the negative upon entry.
- Slippage: In a liquid market, your requested fill price and actual execution price are almost always identical. In low-liquidity environments, a lack of matching counterparties means your market order gets filled at a completely different rate than expected.
2. Structural execution quality
Deep markets guarantee a high fill rate, meaning large block positions are completed instantly at a singular price point. In contrast, thin markets frequently introduce partial fills, where only a fraction of your contract size is executed at your desired price, leaving the remainder unfilled or filled at a worse rate, and broker requotes.
3. Supply and demand price dynamics
Liquidity naturally aggregates around distinct structural points on a chart, forming liquidity zones. Major institutional entities do not hide their orders; they place them where mass participation occurs. These zones typically form around major round psychological numbers and prominent previous swing highs and lows, transforming these areas into powerful structural support and resistance levels.
4. Institutional liquidity grabs
Because large institutions manage sizes that can move markets, they require massive pools of counterparty orders to build or exit positions. To do this, they often drive prices intentionally past obvious support or resistance levels where retail stop-losses cluster.
How to find and measure liquidity on a chart
Traders utilize four primary technical measures to accurately quantify open market liquidity before deploying capital.
Bid-ask spread tracking
Monitoring the real-time spread fluctuation provides an immediate health check on market participation. A steady, ultra-tight spread indicates institutional stability, while a expanding spread acts as an early warning signal of impending volatility or a reduction in market makers.
Depth of market (DOM) / level II data
Level II data exposes the actual electronic order book, displaying the exact volume of resting limit orders waiting at specific price ticks above and below the current market price. This allows traders to see exactly how much volume the market can handle before a price level breaks.
Volume and time-session indicators
Plotting vertical volume bars along the bottom of your chart reveals the total number of shares or contracts changing hands over a given timeframe. Pairing this with a session clock overlay helps identify the structural transition points where liquidity spikes at market opens and tapers off at closes.
Volatility-based ATR filters
Using indicators like the Average True Range (ATR) helps map market behavior. If the ATR spikes while trading volume is simultaneously dropping, it confirms an illiquid volatility environment where price movements are being driven by a lack of order depth rather than strong institutional conviction.
How to adjust trading strategies based on liquidity conditions
A professional trading plan must dynamically shift its rules based on whether the market environment is structurally deep or thin.
       Assess Market Liquidity State
                 /          \
                /            \
    High Liquidity       Low Liquidity
       /        \              /        \
  Scalping Breakouts  Swing Mean Reversion
Which trading strategies work best in liquid markets?
- Scalping and high-frequency styles: High-volume sessions with tight spreads are mandatory for high-turnover strategies. Traders can enter and exit multi-lot positions within minutes or seconds, secure in the knowledge that execution costs will not erode their fractional profits.
- Momentum breakout strategies: When an asset breaks through a key structural level during peak session hours, the influx of matching market orders creates a sustained, smooth directional run that is ideal for trend-followers.
Which trading strategies work best in illiquid markets?
- Swing trading and longer-term position styles: When intraday execution quality is poor, extending your holding period to days or weeks removes the negative impact of short-term slippage and spread spikes.
- Statistical mean reversion: Because thin markets lack the order depth to anchor prices smoothly, they are highly prone to temporary, dramatic price exaggerations. Traders can utilize limit orders to fade these volatile spikes, betting that the price will ultimately snap back to its structural mean once normal participation returns.
Spreads widen at market rollover periods because major global banking institutions temporarily take their automated quoting engines offline to settle daily transactions. This temporary drop in institutional participation creates a brief liquidity vacuum, forcing spreads to expand until the next regional session opens.
No. Market liquidity refers to trade execution ease while volatility refers to price movement.
Liquidity affects spreads, execution speed, slippage, and overall trading costs, making it an important factor in strategy performance.