
- Learn the most effective swing trading strategies, from trend following to price action setups, with real examples across Forex, stocks, commodities and indices.
Swing trading is a multifaceted financial strategy designed to capture short- to medium-term price oscillations within liquid markets. By establishing positions that capitalize on “swings” in price action, traders aim to exploit the natural ebb and flow of market momentum.
These movements are frequently precipitated by shifting economic data, institutional news events, or broader changes in market sentiment. While many swing traders prioritize trend-following techniques, others utilize counter-trend methodologies to profit from mean reversion and price exhaustion.
Swing trades are held typically from several days to multiple weeks, this approach provides a strategic balance between the high-frequency demands of day trading and the capital-intensive nature of long-term position trading.
What Is Swing Trading?
In the spectrum of market participation, swing trading is defined by its reliance on technical analysis to identify optimal entry and exit points. Unlike day traders, who must close all positions before the market wrap, swing traders accept “overnight risk” in exchange for the potential to capture larger percentage moves in the underlying instrument.
Swing Trading vs. Day Trading: Key Differences
Understanding the structural differences between these styles is essential for capital allocation and risk management.
| Feature | Day Trading | Swing Trading |
| Duration | Seconds to hours (No overnight holds) | 2 to 15+ days |
| Market Focus | Order flow and intraday volatility | Structural trends and price cycles |
| Psychological Demand | High; requires constant screen time | Moderate; allows for part-time execution |
| Risk Profile | High leverage, tight stops | Moderate leverage, wider stop-losses |
| Asset Suitability | High-volume equities and FX pairs | Diverse (Forex, Stocks, Commodities, Indices) |
How Swing Trading Works
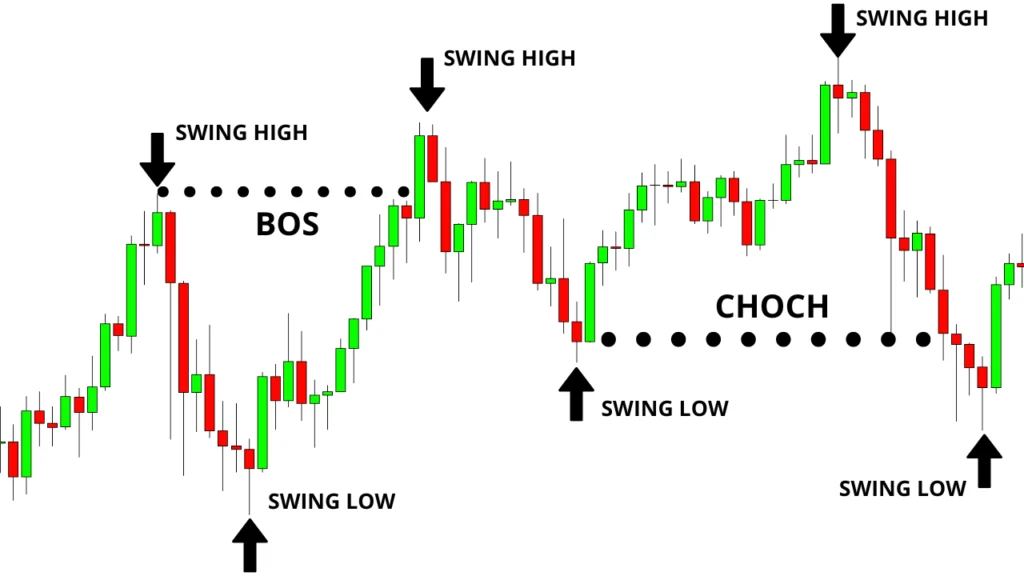
The mechanics of a swing trade rely on identifying a “swing high” or a “swing low.” Traders monitor these structural points to determine where the prevailing momentum may pause or reverse.
Typical Trade Duration and Holding Periods
While there is no fixed rule, the majority of swing trades conclude within a 5-to-10-day window. This period allows the market enough time to complete a “price cycle”, the movement from an oversold state to an overbought state, or vice versa, without requiring the trader to weather the multi-month drawdowns often seen in long-term investing.
Best Markets for Swing Trading
For a swing strategy to remain viable, the market must possess two key characteristics: Volatility (price movement) and Liquidity (the ability to enter and exit without significant slippage).
- Forex: Major pairs like EUR/USD and GBP/USD offer the constant fluctuations necessary for trend-following and reversal strategies.
- Stocks & ETFs: Large-cap equities and broad indices (e.g., S&P 500) provide the structural stability favored by technical analysts.
- Commodities: Assets such as Gold (XAU/USD) and Crude Oil (WTI) are highly sensitive to geopolitical shifts, often creating clear, multi-day trends.
Core Swing Trading Strategies
1. Trend-Following Strategy
Trend following is the most fundamental swing trading approach. It operates on the premise that an asset in a defined uptrend or downtrend is statistically more likely to continue in that direction than to reverse. Traders look to identify the dominant market bias and align their positions with the prevailing momentum.
What Are The Core Entry Conditions in Trend-Following Strategy?
- Price Structure: The market must establish a verifiable sequence of higher highs and higher lows for an uptrend, or lower highs and lower lows for a downtrend.
- Moving Average Alignment: Prices should trade consistently above a significant medium-term filter, such as the 50-day Simple Moving Average (SMA), which serves as a baseline for trend health.
- Momentum Validation: Indicators like the MACD or Average Directional Index (ADX) should confirm strengthening momentum. An ADX reading above 25 typically suggests a strong trending environment.
- Daily Candle Confirmation: Entry is ideally triggered on a daily candle close that signals the end of a brief counter-trend correction and the resumption of the main move.

Common Entry Strategies
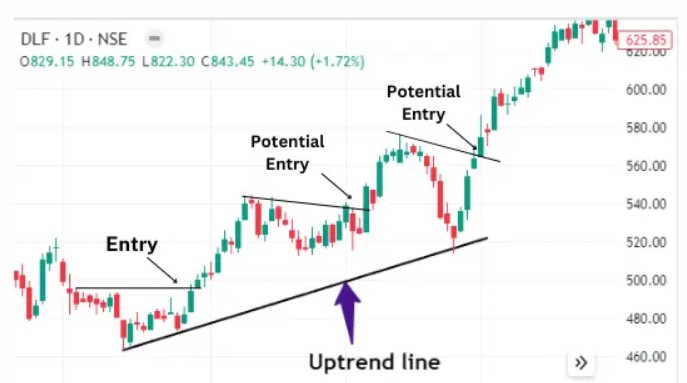
- Moving Average Bounce (Aggressive): Entering as soon as the price touches and rejects a key moving average like the 20-EMA or 50-SMA.
- Swing High/Low Break (Conservative): Waiting for the price to break above the most recent peak in an uptrend to confirm momentum has officially returned.
- Trendline Touch: Drawing a diagonal support line and entering when the price provides a third or fourth touch and a bullish rejection candle.
Common Pitfalls to Avoid
- Trading Overextended Trends: Entering a position after the price has already moved significantly away from its mean, which often results in buying at the absolute peak.
- Ignoring Macro Counter-Trends: Failing to recognize when a larger timeframe (like the Weekly chart) is showing a reversal signal that contradicts your Daily trend.
- Late Entries: Hesitating on the entry signal until the risk-to-reward ratio is no longer favorable.
Breakout Strategy
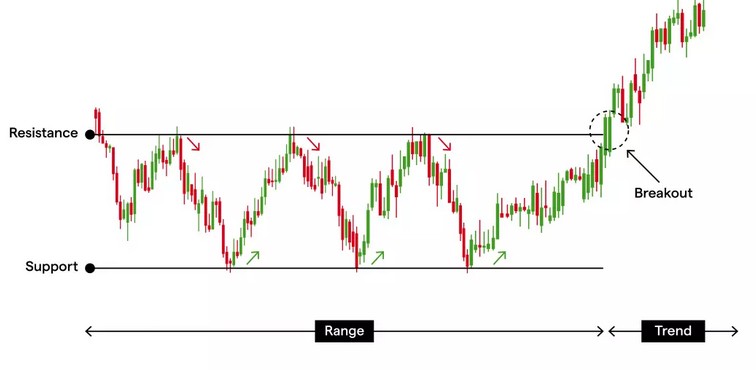
A breakout strategy involves entering a trade when the price moves decisively above a defined resistance level or below a structural support, signaling the initiation of a new, high-momentum trend. Traders capitalize on price expansion following a period of consolidation by utilizing volume spikes and momentum-driven daily candles to confirm the move.
This systematic approach aims to filter out false signals, or “fakeouts”, by often targeting an entry on a retest of the broken level, where previous resistance converts into new support.
Key Components of a Breakout Strategy
Identify Key Levels: Locate strong support and resistance lines, or use tools like Trendlines, Moving Averages (e.g., 200 EMA), and Fibonacci levels (50% or 61.8%).
Volume Surge: A valid breakout is usually accompanied by a sharp increase in trading volume (i.e $1.5 to 2 times the average volume), indicating strong institutional participation and conviction.
Momentum Candles: Look for large, solid candles closing well beyond the resistance or support level.
Retest Strategy: Instead of entering immediately, wait for the price to return to the broken level (former resistance becomes support, or vice-versa) before entering, which helps avoid false breakouts.

Common Breakout Strategy Entry Methods
- Immediate Entry (Aggressive): Entering the position as soon as the daily candle closes beyond the support or resistance level to capture the initial momentum.
- Retest Entry (Conservative): Waiting for the price to break out, then return to test the broken level (old resistance becomes new support, or vice-versa) before continuing in the breakout direction.
- Volatility Squeeze Entry: Identifying a period of extreme price contraction and entering when the price breaks the boundary as Bollinger Bands begin to expand.
Why Do Breakout Strategies Fail? Common Trading Mistakes to Watch For
- Entering too early: Acting on a wick rather than a solid candle close can lead to false breakouts (fakeouts) and immediate reversals.
- Low-volume breakouts: A breakout with low volume suggests a lack of institutional conviction and carries a high probability of failing.
- Chasing the move: Entering too late after the price has already moved significantly, resulting in an poor risk-to-reward ratio and a wide stop-loss.
- Ignoring the Trend: Attempting to trade a breakout against the dominant long-term trend, which often results in a “bull trap” or “bear trap.”
Effective risk management is essential, with traders typically placing stop-loss orders slightly within the breakout zone while aiming for profit targets that are at least two times greater than the potential loss.
Pullback / Retracement Strategy
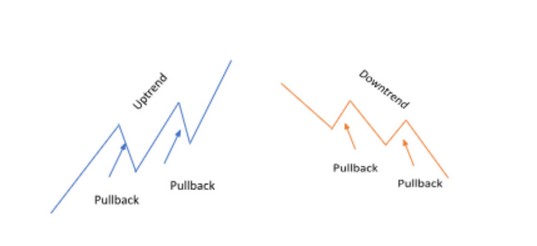
A pullback or retracement strategy involves entering a trade during a temporary price correction against an established trend to secure a “discounted” entry price. This approach aims to capitalize on the resumption of the primary trend following a brief period of profit-taking or market consolidation.
By identifying strong impulsive moves and waiting for shallow counter-trend movements to key technical zones, traders can achieve superior risk-to-reward ratios compared to chasing price momentum.
Key Components of a Pullback Strategy
- Identify the Trend: Confirm a robust, established trend by ensuring the price is making consistent higher highs and higher lows (uptrend) or lower highs and lower lows (downtrend).
- Wait for Retracement: Avoid chasing parabolic moves; instead, wait for the price to move contra-trend toward a logical area of value.
- Identify Key Levels: Look for the retracement to find support or resistance at previous structural zones, dynamic moving averages (e.g., the 20-period EMA), or Fibonacci retracement levels ($38.2% to $61.8%$).
- Entry Confirmation: Monitor for localized price action signals such as hammers, engulfing candles, or a strong momentum shift back toward the direction of the primary trend.
- Stop-Loss Placement: Position the stop-loss order just below the most recent low of the pullback in an uptrend, or above the recent high in a downtrend, to protect against a full trend reversal.

Support and Resistance Strategy
A support and resistance strategy identifies key price levels where an asset historically tends to stop falling (support) or stop rising (resistance), allowing traders to capitalize on market “floors” and “ceilings.” By recognizing these psychological zones, traders can execute high-probability trades based on price bounces or breakout shifts.
Identifying these levels on higher timeframes increases accuracy, while using price action confirmation, such as specific candlestick patterns, ensures the level is being respected before an entry is made.
Key Components of the Strategy
- Support (Floor): Specific price areas where buying demand is historically strong enough to halt a downward move, frequently resulting in a bullish price bounce.
- Resistance (Ceiling): Established zones where selling pressure is strong enough to prevent the price from rising further, often triggering a bearish reversal.
- Role Reversal: A fundamental concept where a broken resistance level frequently transforms into a new support level (and vice versa), providing a foundation for secondary trade setups.
- Zones, Not Lines: Professional traders treat support and resistance as flexible areas of interest rather than exact, single price points to account for market noise and volatility.
How to Execute the Support and Resistance Strategy
- Identify Levels: Locate significant swing highs and lows on the daily or weekly charts to find the most influential structural zones.
- Confirm Strength: Prioritize levels that have been tested multiple times without breaking, as these represent areas of higher institutional conviction.
- Wait for Price Action: Avoid entering immediately upon a touch; wait for a confirmation signal, such as a rejection candle or a pin bar, to prove the zone is holding.
- Execute the Trade:
- Bounce (Range Trading): Initiate a buy order at support or a sell order at resistance when a rejection is confirmed.
- Breakout (Trend Trading): Enter a short position if price breaks decisively through support, or a long position if it clears resistance.
What Are the Most Common Support and Resistance Trading Mistakes?
- Over-complicating Charts: Drawing too many minor levels can lead to conflicting signals; focus only on the most prominent historical zones.
- Ignoring the Primary Trend: Buying support in a massive downtrend is high-risk; the highest probability trades occur when the bounce aligns with the broader market direction.
- Late Entries: Entering a bounce after the price has already moved significantly away from the zone, which degrades the risk-reward ratio.
- Static Thinking: Failing to adjust levels as market conditions change or as new structural highs and lows are formed.
Moving Average Crossover Strategy
A moving average crossover strategy is a trend-following technical analysis method that utilizes two separate moving averages, a short-term “fast” MA and a long-term “slow” MA, to generate potential buy and sell signals. By smoothing out erratic price fluctuations, this strategy helps traders identify the birth of a new trend. A bullish signal is generated when the fast MA crosses above the slow MA, while a bearish signal is triggered when the fast MA crosses below the slow MA.
Key Components of the Strategy
- Fast Moving Average: Designed to respond rapidly to recent price fluctuations, typically utilizing shorter periods such as 10 or 20 to capture immediate momentum shifts.
- Slow Moving Average: Smoothes out daily market noise to reveal the broader trend direction, commonly utilizing longer periods such as 50 or 200.
- Moving Average Selection: Traders choose between the Simple Moving Average (SMA) for long-term structural clarity or the Exponential Moving Average (EMA) for a faster response to current price action.
What are the trading signals for a moving average crossover?
- Golden Cross (Bullish): This occurs when the shorter-term MA crosses above the longer-term MA, signaling that upward momentum is accelerating and providing a potential buy entry.
- Death Cross (Bearish): This occurs when the shorter-term MA crosses below the longer-term MA, indicating that downward momentum is increasing and providing a potential sell or exit signal.
What are The Common Moving Average Combinations
- Short-Term/Scalping: Traders often utilize the 5 and 10 EMA or the 9 and 20 EMA to capture very fast, high-frequency price movements.
- Day and Swing Trading: The 20 and 50 SMA or EMA combination is a standard for medium-term traders looking to capture multi-day price swings.
- Long-Term/Investing: The 50 and 200 SMA is the most widely recognized institutional combination used to identify major shifts in market regimes.
What Are the Most Common Moving Average Trading Mistakes?
- Whipsaws in Range-Bound Markets: Moving averages are trend-following tools; using them in a sideways or “choppy” market will result in frequent false signals and minor losses.
- Delayed Entries: Because moving averages are lagging indicators, the crossover often occurs after a significant portion of the move has already happened.
- Over-Optimization: Constantly changing the periods of your averages to fit past data (curve-fitting) often leads to strategies that fail to perform in live market conditions.
Technical Indicators for Swing Trading
Swing traders utilize a combination of trend, momentum, and volatility indicators to identify short- to medium-term opportunities. These tools help filter market noise and provide objective confirmation for entries and exits, typically over a holding period of several days to weeks.
RSI (Relative Strength Index)
The RSI is a momentum oscillator that measures the speed and change of price movements on a scale of 0 to 100. It is primarily used to identify overextended market conditions and potential reversal points.
- Overbought/Oversold: Readings above 70 suggest an asset is overbought (potential sell), while readings below 30 suggest it is oversold (potential buy).
- Centerline Crossover: A move above 50 indicates bullish momentum, while a move below 50 indicates bearish momentum.
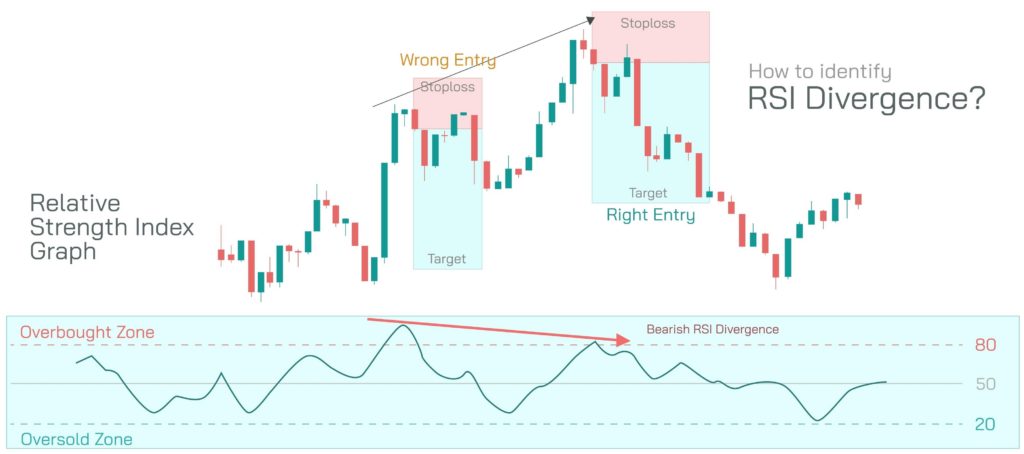
- Divergence: If price makes a new high but the RSI does not, it signals weakening momentum and a likely trend reversal.

MACD (Moving Average Convergence Divergence)
The MACD is a trend-following momentum indicator that shows the relationship between two moving averages of an asset’s price. It is highly effective for confirming trend strength and identifying crossover signals.
- MACD Line Crossover: A bullish signal occurs when the MACD line crosses above the signal line; a bearish signal occurs when it crosses below.
- Histogram Analysis: The bars show the distance between the MACD and signal lines; expanding bars indicate increasing momentum, while contracting bars suggest a slowdown.
- Zero Line: Trading above the zero line generally indicates a bullish regime, while trading below it suggests a bearish bias.
Bollinger Bands
Bollinger Bands measure market volatility and provide dynamic levels of support and resistance. They consist of a middle moving average and two outer bands set at standard deviations.
- The Squeeze: When the bands tighten, it indicates low volatility and often precedes a significant price breakout.
- The Bounce: In range-bound markets, the price often “bounces” off the upper and lower bands.
- Walking the Bands: During a strong trend, the price may “hug” the upper or lower band, indicating high-conviction momentum.
Risk Management in Swing Trading
Effective risk management is the foundation of professional trading, ensuring that a single losing trade or a series of losses does not result in significant capital depletion.
How to Set a Stop Loss for Swing Trades
A stop-loss order is a predetermined exit point used to limit potential losses if the market moves against your position.
- Structural Stops: Placing the stop-loss just below the most recent swing low (for long trades) or above the recent swing high (for short trades).
- Technical Stops: Using key levels like moving averages, Bollinger Bands, or support/resistance zones as a barrier.
- Volatility-Based Stops: Using the Average True Range (ATR) to set a stop that accounts for the asset’s typical daily price fluctuations.
Position Sizing Rules
Position sizing determines the number of units to trade based on the amount of capital you are willing to risk per setup.
- The 1% Rule: Never risk more than 1% of your total account equity on a single trade.
- Calculation: Divide your total dollar risk (1% of account) by the distance between your entry price and your stop-loss price.
- Consistency: Maintaining a consistent position sizing model prevents emotional decision-making during periods of market volatility.
Risk-Reward Ratio Explained
The Risk-Reward Ratio (RRR) measures the potential profit of a trade relative to its potential loss.
- The 1:2 Minimum: For every $1 risked, you should aim for at least $2 in potential profit.
- Statistical Advantage: With a 1:2 RRR, you only need to be right 35% of the time to remain profitable over the long term.
- Targeting: Always ensure your profit target is placed at a logical structural level (like the next major resistance) that allows for your desired RRR.
How to Build a Swing Trading Plan
A trading plan is a documented strategy that outlines exactly how and when you will interact with the market, removing emotional bias from the process.
Choosing Your Market and Timeframe
- Asset Selection: Focus on liquid markets such as Major Forex pairs (EUR/USD), Blue-chip stocks, or Commodities (Gold/Crude Oil).
- Primary Timeframe: Use the Daily (D1) chart for identifying setups and trends.
- Secondary Timeframe: Use the 4-Hour (H4) or 1-Hour (H1) charts to fine-tune entry execution and stop-loss placement.
Defining Entry, Exit and Stop Rules
- Entry Trigger: Define the exact signal required to enter (e.g., “A daily close above resistance with RSI > 60”).
- Exit Strategy: Determine how you will take profits, whether through fixed targets, trailing stops, or technical reversals.
- Stop Rules: Explicitly state where your stop-loss will be placed for every trade before you execute the order.
Common Swing Trading Mistakes to Avoid
- Overtrading: Entering low-quality setups because of boredom or a desire to be constantly “in the market.”
- Ignoring the News: Failing to check the economic calendar for high-impact events like interest rate decisions that can cause extreme slippage.
- Revenge Trading: Increasing position sizes after a loss to try and “win back” the money quickly.
- Removing Stop-Losses: Moving a stop-loss further away in hopes the price will reverse, which often leads to catastrophic account drawdowns.
Frequently Asked Questions
Swing trading is profitable when executed with a proven strategy, disciplined risk management, and a positive risk-to-reward ratio. Success depends on the trader’s ability to remain consistent through market cycles and manage emotional biases. While profitable for many, it requires a deep understanding of technical analysis and market structure.
While many brokers allow you to start with as little as $500, a starting capital of $2,500 to $5,000 is recommended for professional swing trading. This amount allows for proper position sizing under the 1% risk rule, ensuring that a single loss does not significantly impact your total account equity.
The Daily (D1) chart is widely considered the best timeframe for swing trading as it effectively filters out intraday market noise and clearly displays structural trends. Many traders also utilize the 4-Hour (H4) chart to fine-tune entry and exit points after identifying a setup on the daily timeframe.
Yes, you can swing trade Forex and stocks simultaneously, which is a common strategy for diversifying a portfolio across different asset classes. Because swing trading involves multi-day holding periods and less frequent monitoring than day trading, it is easier to manage a diverse watchlist of currency pairs, equities, and commodities at once.