Yesterday was a very volatile day in the energy market with crude oil price swinging in both directions on the back of conflicting news.
On one hand, the EIA Crude Inventories Report showed a greater than expected drop in stockpiles. Data released to the markets showed that US crude stockpiles fell by more than 10 million barrels for the week ended July 19, as against the expected drop of 4 million barrels. Crude oil spiked above $57, only for it to come crashing down to $55.22 as a Reuters report monitored from Kuwait’s news agency (KUNA) indicated that Saudi Arabia’s energy minister had paid a visit to Kuwait to discuss resumption of crude oil production in the undefined border between both countries, the Saudi-Kuwait Neutral Zone.
The situation in the Strait of Hormuz as well as concerns for the global economic outlook will continue to be the fundamentals that will dominate crude oil prices heading into next week.
Crude Oil Technical Play
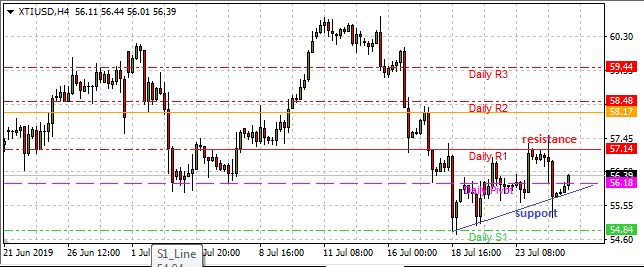
Crude oil (WTI) is presently trading at $57.42, and seems to be making an intraday push to the R1 pivot where the $57 price high achieved yesterday is located. The asset is being supported by a rising support trend line on the 4-hour chart which extends from the S1 low to the central pivot. A break of the $57.14 intraday high will open the door for a push to the $58.17 price level (R2 pivot). On the flip side, a downside break of the ascending support line (which intersects the central pivot) will open the gateway for targeting the $54.84 S1 pivot.Don’t miss a beat! Follow us on Twitter.
Download our latest quarterly market outlook for our longer-term trade ideas.
Do you enjoy reading our updates? Become a member today and access all restricted content. It is free to join.