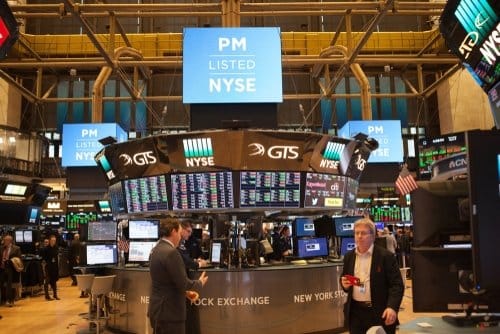
Traders on the S&P 500 index and other global markets woke up to the news that a new and more contagious strain of the coronavirus was in the UK. In the words of UK Health and Social Care Secretary Matt Hancock, the spread of this new strain was “out of control”.
As expected, risky commodity assets and global stock markets sold off sharply as investors sought out safe-haven assets. This has given the US Dollar some reprieve, but sent energy stocks tumbling as crude oil prices shed more than 4% on the day.
Why This Is a Big Deal
With a large-scale viral outbreak, there is always the fear of recombinant mutation. The result? You end up with a bug that is more transmissible, or more virulent.
Now here is the bad news. A virus can mutate so fast that a vaccine against an original strain may not necessarily work with a new strain, or may not be as effective. If things are not done quickly to contain the spread of the new form, there could be major problems. This is why European countries are moving quickly to close their borders to the UK. However, other countries are still taking in UK travellers, and this could allow the virus to cross geographical boundaries.
The worst case scenario is a massive global spread of the new variant, which means all the work done so far in developing vaccines, containment protocols, as well as all the economic stimulus which have so far yielded results, could all be for nothing.
Investors and institutional traders are working out the scenarios, which is why the selloff has been very steep today. All 11 major S&P 500 sectors are down.
Technical Levels to Watch
The S&P 500 formed a topping bearish engulfing candle pattern to end the previous week, which precipitated today’s drop technically speaking. Buyers were able to suspend the downside move at the 3645.4 support. This remains the initial target if the selloff resumes. A breakdown opens the door towards 3528.9, with 3481.6 also lining up as additional support.
Resumption of the uptrend requires a break of the 3722.4 all-time high. 3738.6 (127.2% Fibonacci extension) could be the new target. This depends on whether investors will choose to place their bets on the US stimulus package agreed on yesterday and which will be subjected to a vote later on Monday.
Don’t miss a beat! Follow us on Telegram and Twitter.
S&P 500 Daily Chart
More content
- Download our latest quarterly market outlook for our longer-term trade ideas.
- Follow Eno on Twitter.
- Do you enjoy reading our updates? Become a member today and access all restricted content. It is free to join.


