The VIX index plunged to $20 for the fifth time this year as the market volatility eased. It was trading at $20.57, which was about 41% below the highest level in September. The index has dropped to the lowest level since August 22nd. This decline coincided with the sharp decline of the US dollar index (DXY) and the recovery of American indices like S&P 500 and Dow Jones.
Risk-on sentiment
The CBOE VIX index has been in a strong downward trend in the past few weeks as investors embraced a risk-on sentiment. This sentiment comes at a times when sentiment in the United States has improved. The unemployment rate has dropped significantly while inflation has dropped. Data by the American government showed that the headline consumer inflation dropped to 7.7% in October.
The VIX index has retreated at a time when stocks have continued surging. According to TradingView, the S&P 500 index surged by more than 16% from the lowest level this year. Similarly, the Dow Jones and Nasdaq 100 indices have surged as well and exited the bear market. In a statement, Jerome Powell said that the Fed will start hiking rates at a smaller pace.
Meanwhile, the fear and greed index is approaching the extreme greed zone. It rose to a high of 70, which was the highest level in months. As such, it could soon cross the 75 level, which will see it move to the extreme greed zone. Safe haven demand, stock price breadth, and stock price strength have risen to extreme greed while put and call options and junk bond demand rose to the greed level.
Therefore, there is a likelihood that the index will continue falling as long as American stocks continue their recovery. Historically, VIX has an inverse correlation with American stocks.
VIX index forecast
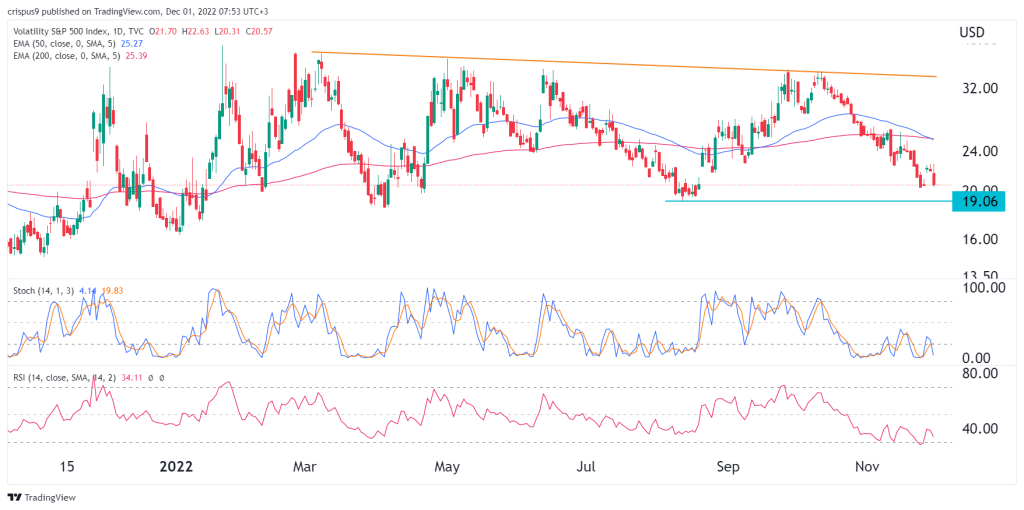
The daily chart shows that the CBOE VIX index formed a triple-top pattern, which is a bearish sign. In price action analysis, this pattern is usually a bearish sign. The index has formed a death cross, which is a bearish sign. This pattern forms when the 200-day and 50-day moving averages crosses over. The Stochastic Oscillator and the Relative Strength Index (RSI) moved to the oversold level.
Therefore, the index will likely cruise below $19. A move above the resistance at $22 will invalidate the bearish view.