USDZAR is under selling pressure for one more day, giving up 0.52% at 14.6910 despite the South Africa Manufacturing Production Index (year over year) came in at -1.1%, below forecasts of-1% in July. Later today traders await the US NFIB small business optimism index while the focus will be on the FOMC decision on September 18th for fresh trading impulse. The latest Rand Merchant Bank / Bureau for Economic Research survey of businesses as well as the Absa Purchasing Managers’ Index (PMI) and the Sacci Trade Conditions Indicator, are signalling low business confidence amid a challenging environment locally and globally.
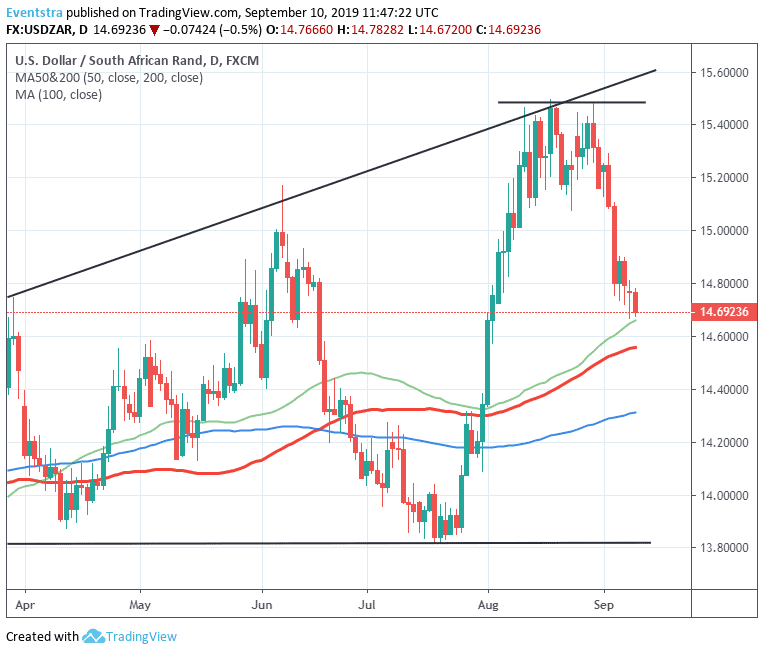
The South African Rand is under heavy selling pressure since August 29th after hit the YTD high at 15,49. On the technical side, USZAR facing the strong support at 14.6590 the 200-day moving average, which if broken might accelerate the slide further towards 14.5587 the 100-day moving average. On the upside immediate resistance stands at 14,7828 today’s high and then at 15.1064 the high from September 4th; a credible break above will pave the way for an attempt to yearly highs at 15.50.Don’t miss a beat! Follow us on Telegram and Twitter.
Download our latest quarterly market outlook for our longer-term trade ideas.
Do you enjoy reading our updates? Become a member today and access all restricted content. It is free to join.