The recent rally of the South African rand (USDZAR) has hit a dead end. The pair is trading at 16.8600, which is higher than last Friday’s low of 16.5298.
The South African rand is falling because of two reasons. First, the US dollar is relatively strong today. Indeed, the dollar index, which measures the strength of the dollar against key peers has gained by more than 0.50%.
This is because the greenback has gained against most currencies in the developed and emerging markets partly because of the impressive economic data that were released last week. These numbers showed that the American economy is in a recovery path even as the coronavirus risks remain.
The USDZAR has also gained because of the weak GDP data released by the South African Bureau of Statistics. The data showed that the South African economy contracted by 17.1% in the second quarter after rising by 0.1% in the first quarter. This decline was worse than the 16.5% drop that analysts polled by Bloomberg were expecting. As a result, the economy contracted by a whopping 51% on a year-on-year basis.
In contrast, the Chinese economy rose by 3.2% in the second quarter while the Eurozone’s economy contracted by 11.8%. And analysts expect that the South African economy will continue to struggle as traditionally-important sectors like mining and manufacturing gets decimated. Also, there are concerns about the country’s debt, which has grown exponentially recently.
USDZAR technical outlook
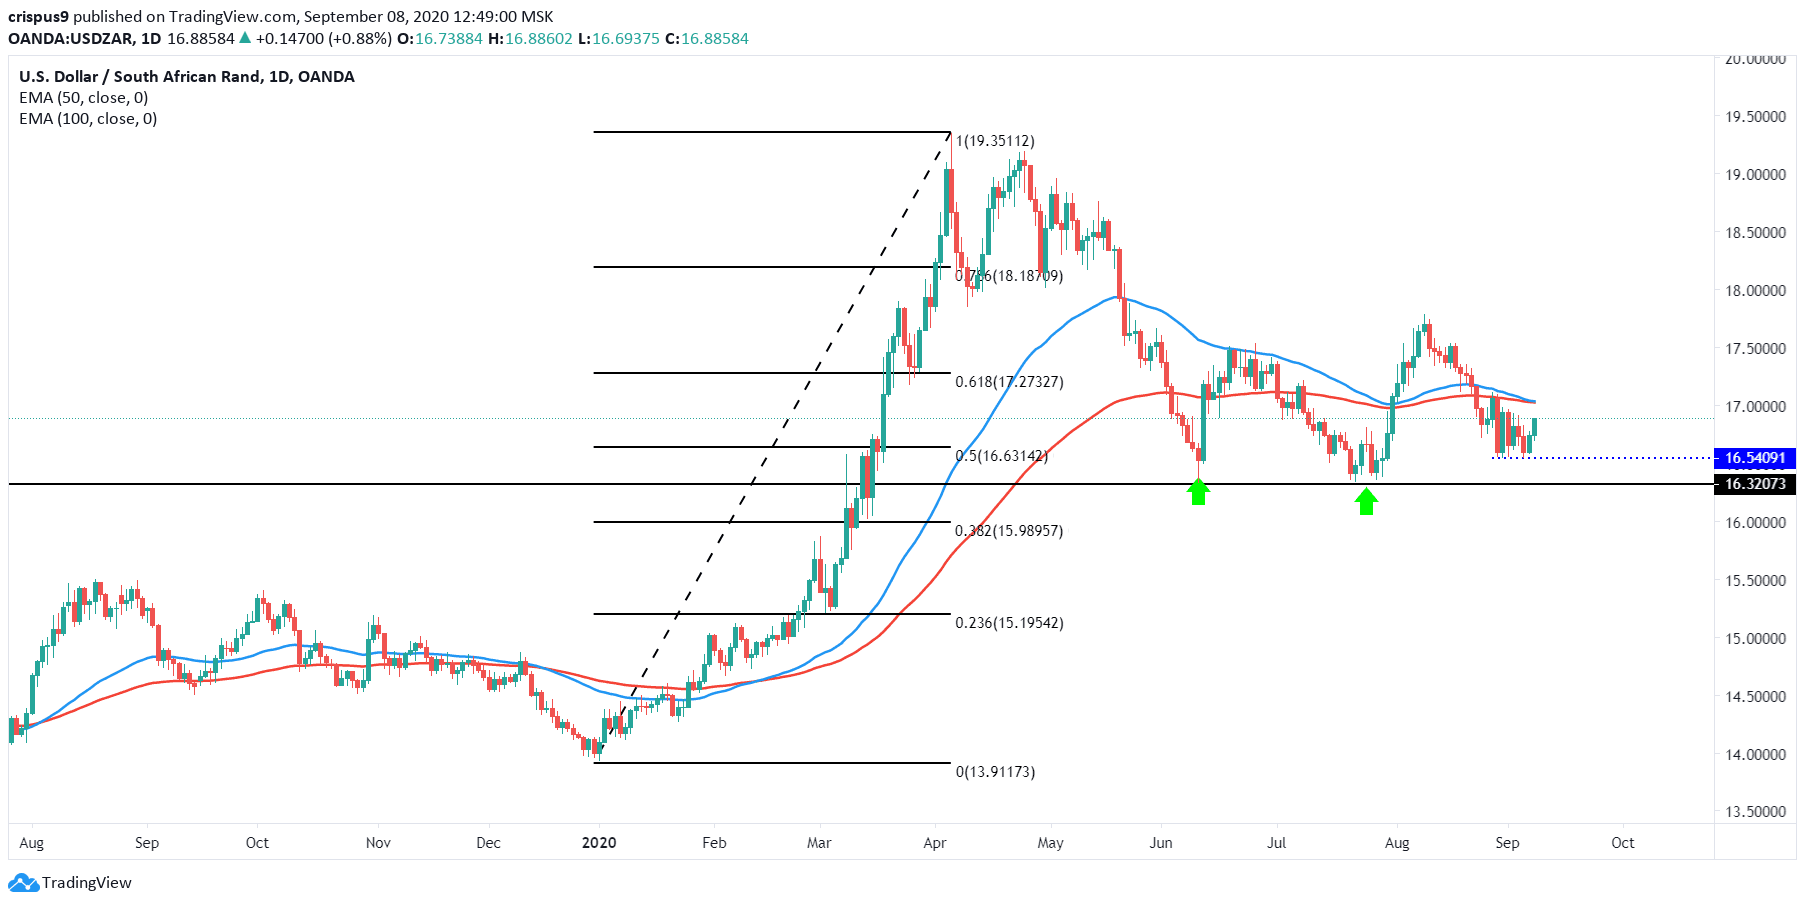
A look at the daily chart shows that the USDZAR pair formed a double bottom pattern at 16.5400 last week. This price was along the 50% Fibonacci retracement level. The price remains below the 50-day and 100-day exponential moving averages. But with today’s gains, the price is approaching the two averages.
Therefore, I suspect that the price will once again attempt to rise as it has done in the past two times shown with the green arrows. For this to happen, the pair will need to move above the two averages and the psychological level at 17,000. On the flip side, a move below the double bottom at 16.5400 will send a signal that there are more sellers in the market who will be keen to push the price lower to 16.3200.
Like our analysis? We can help you become a better trader for free. Just enrol to our free forex trading course here.
Don’t miss a beat! Follow us on Telegram and Twitter.
USDZAR technical chart
More content
- Download our latest quarterly market outlook for our longer-term trade ideas.
- Follow Crispus on Twitter.
- Do you enjoy reading our updates? Become a member today and access all restricted content. It is free to join.