There has been quite some hesitancy on the USD/TRY pair after last week’s FOMC decision undermined the resolve of USD bulls to push prices higher. Yes, the decision delivered a 76 bps rate hike. But there were not a few segments of traders who half-hoped on a 100 bps rate hike.
The decision and accompanying statement by the Fed Chair Jerome Powell came across as a decision by the Fed to take things a bit easy going forward. As such, the USD/TRY finds itself squirming around the 17.96991 resistance with little resolve to move forward at the moment.
On the side of the Turkish Lira, things continue to remain bleak. Manufacturing data show that the performance of the country’s production sector worsened at its fastest pace in two years on the back of weaker demand and additional market uncertainty. As a result, Turkey’s PMI dropped from 48.1 to 46.9 in June, a 5th consecutive monthly drop.
Turkey’s inflation has hit 80% after its latest interest rate decision that kept rates steady at 14%. As a result, Turkey’s central bank (CBRT) has lifted its 2022 year-end inflation forecast from 42.8% a quarter ago to 60.4%. However, how the CBRT reacts to the scenario remains to be seen.
The services PMI data from the Institute of Supply Management and the Non-Farm Payrolls report on Friday are the fundamental triggers of note for the greenback. In contrast, Turkey has a light calendar for the week. This leaves the USD/TRY pair at the mercy of USD fundamentals. Price action is expected to pick up from Wednesday when the PMI data for the US services sector kicks in.
USD/TRY Forecast
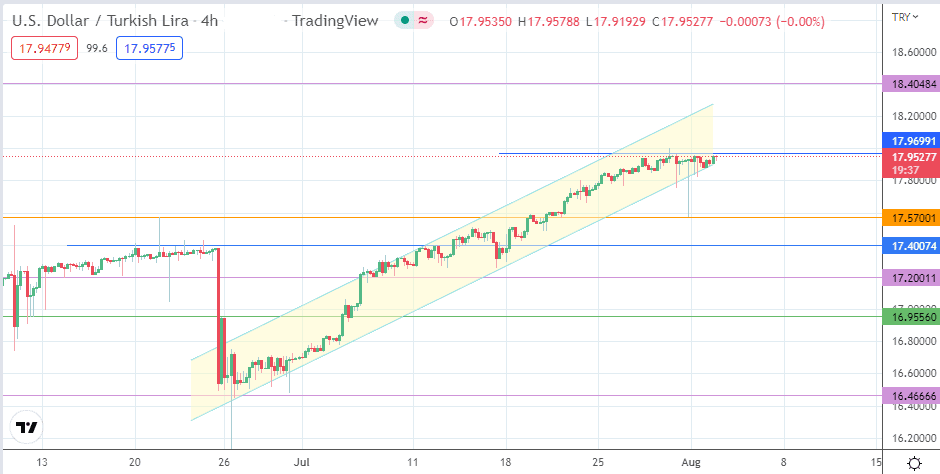
The pair is testing the resistance at 17.96991, where recent price action appears to have stalled. A break of this level gives the bulls a clear path toward the all-time high at 18.39910, but this move will have to take out the 18.32812 price mark where the 27% Fibonacci extension of the 5 May – 29 July price swing. If the price action transcends this level, a potential new target to the upside comes into the picture at 19.30106, where the 61.8% Fibonacci extension lies.
On the flip side, a rejection at the current resistance allows for a pullback, first to the 17.5700 price mark (21 June 2022 high/31 July 2022 low) before subsequent pivots at 17.40074 (24 June high) and 17.20011 (15 June low) enter the picture. The 5 June low at 16.9556 and the 27 June price pivot at 16.46666 are additional southbound targets for the bears.
USD/TRY: 4-hour Chart