The steep sell-off of the USD/SGD price continued on Thursday morning as the US dollar index (DXY) plunge resumed. It plunged to a low of 1.3037, the lowest it has been since January 2018. This plunge means that the pair has fallen by 10% from its highest point in 2022. It has also fallen in the past seven straight weeks.
The main reason why the USD to SGD exchange rate continued plunging is the decision by the Federal Reserve to downshift its interest rate hikes. In its first decision of the year, the Fed decided to hike rates by 0.25% as it embarked on a relatively dovish tone. Before that, it had hiked by 0.50% in its December meeting and by 0.75% in the previous four.
The USD/SGD exchange rate will next react to the upcoming American non-farm payrolls (NFP) data scheduled for Friday. These numbers are expected to show that the labor market eased quite a bit in January as many large and small companies embarked on a cautious tone. PayPal, Rivian, and Meta Platforms are some of the top companies that have announced significant layoffs recently.
USD/SGD price forecast
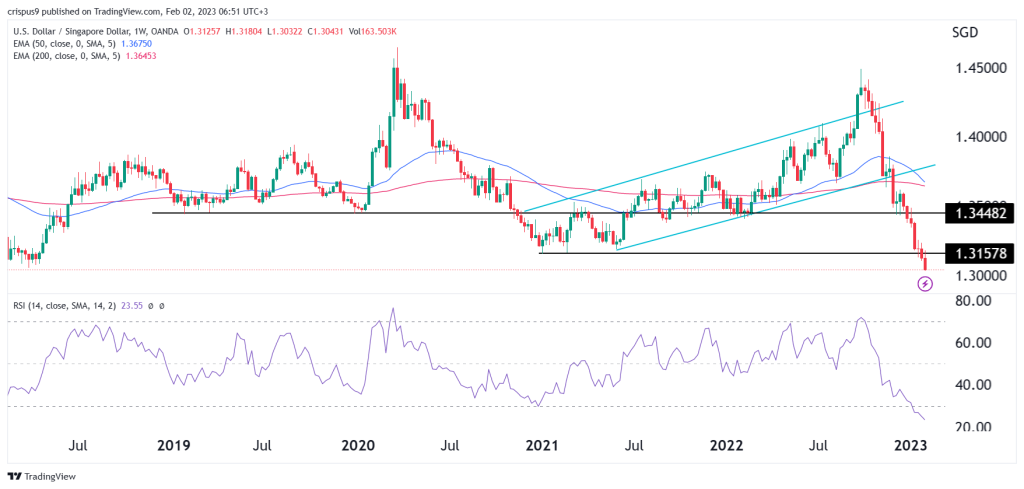
On the weekly chart, we see that the USD/SGD exchange rate has been in a strong downward trend in the past few months. This plunge continued with the pair crashing below the important support at 1.3448 on December 27, which was the lowest level on February 7, 2022, January 13, 2020, and January 28, 2019. The USD to SGD price also slipped below the ascending channel shown in green on November 28 last year.
At the same time, the pair is about to form a death cross, with the 50-week and 200-week volume-weighted moving averages about to crossover. The pair moved below 1.3157, the lowest point since 2021. At the same time, the Relative Strength Index (RSI) has moved below the oversold level and is now at 24.
Therefore, it seems like bears are in the driver’s seat, which will see the USD/SGD price continue falling. If this happens, the next level to watch will be at 1.3000. A stop-loss for this trade will be at 1.3157.
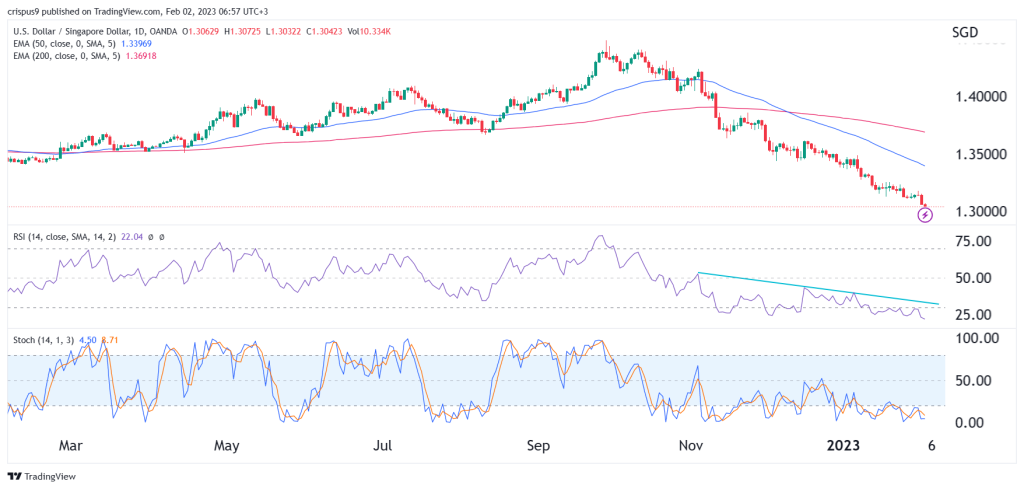
USD to Singapore dollar analysis
In my last article on the USDSGD price, I warned that it would continue falling. The daily chart shows that the USD to SGD exchange rate has been in a steep downward trend in the past few days. Unlike in the weekly chart, it has already formed a death cross on December 9. The RSI has also moved below the oversold level at 30 while the Stochastic Oscillator has been in a steep downward trend.
Therefore, the outlook of the USD/SGD is still bearish until we see signs of a reversal like head and shoulders or a double-bottom pattern. As such, the Singapore dollar could keep its momentum and rise to 1.2950.