The USD/JPY price has pulled back sharply recently as investors reacted to the latest Japan inflation data and the ongoing currency interventions. It was trading at 139.75, where it has been in the past few days. The pair has crashed by more than 8% from its highest level this year and is hovering near its lowest level since September 1.
Japan inflation soars
The USD to JPY price remained in a tight range after the latest inflation data from Japan. According to the statistic agency, the headline consumer inflation jumped to a 40-year high of 3.6%. This growth was accelerated by processed food and the fading impact of mobile phone fee cuts. National CPI rose from 0.3% to 0.6% on a month-on-month basis.
Still, the soaring inflation will likely not have an impact on the Bank of Japan (BoJ). Unlike other central banks, the BoJ has avoided rate hikes and quantitative tightening (QT). Instead, the bank has left interest rates unchanged and continued printing funds in line with its QE program.
The USD/JPY has dropped recently as investors react to the BoJ currency interventions. It is spending billions of dollars to boost the Japanese yen since the weaker currency is making life difficult for Japan’s importers.
The pair will next react to the latest US existing home sales data. Economists expect the numbers to reveal that sales dropped from 4.7 million to 4.3 million in October as interest rates continued rising, Most analysts expect that the Fed will now start slowing the pace of rate hikes.
USD/JPY forecast
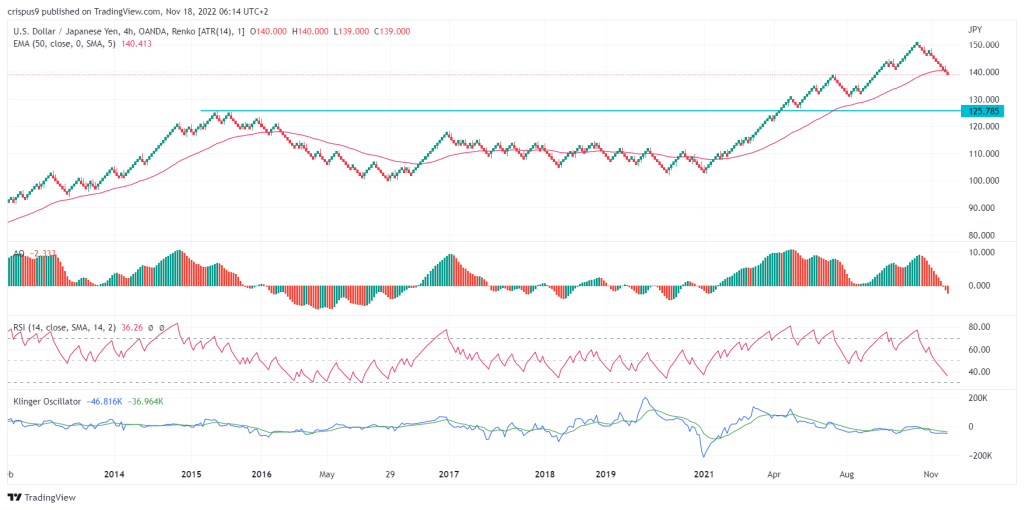
The chart below is known as renko and is relatively different from Japanese candlesticks because it focuses on price movements. It shows that the USD/JPY price has been under pressure in the past few days. In this period, it has moved below the 50-day exponential moving average (EMA).
The Klinger oscillator is hovering at the neutral level while the awesome oscillator has moved below the neutral level. The RSI has moved close to the oversold level. Therefore, the renko chart suggests that the pair will continue falling as sellers target the key support level at 125.78. A move above the resistance at 143 will invalidate the bearish view.