The 1.77% uptick in the Unilever share price on Tuesday made the stock part of the high flyers in the healthcare sector, which lifted the FTSE 100 index by 0.4%. However, fortunes seem to have reversed for the company’s stock as it is in red territory this Wednesday in what can be explained as some profit-taking by buyers.
On the fundamental side of things, Unilever has partnered with AXA and Tikehau Capital to form an impact fund which will support regenerative agriculture. Unilever and each of these partners will contribute 100 million Euros each as seed capital for the fund. According to a statement by AXA, the fund’s target size is 1 billion euros, with the balance to be sourced from other investors interested in the project. Tikehau Capital will manage the fund.
The Unilever share price decline puts the stock in the top 20 of the FTSE 100’s losers chart. It is down 0.93% as of writing. Analysts at Goldman Sachs have set a 12-month price target of 4100p for the Unilever share price. At the current price of 3674.0, the Goldman Sachs price target provides a potential upside of 11.6%.
Unilever Share Price Outlook
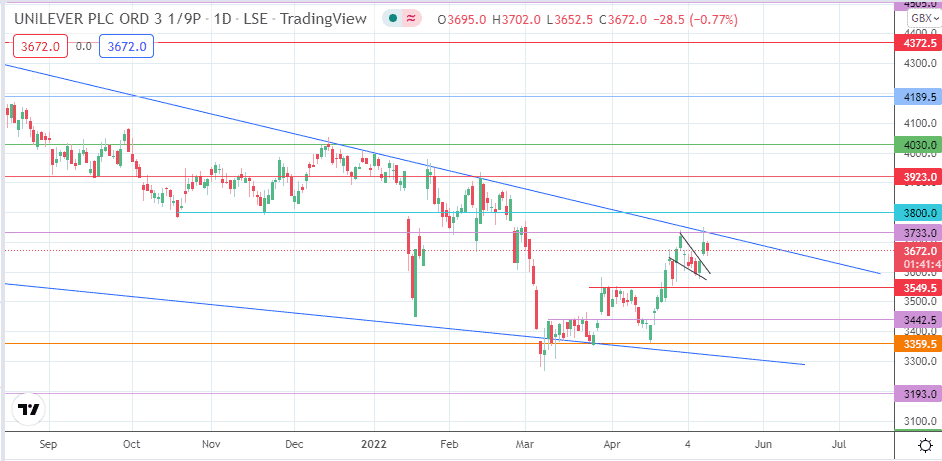
Yesterday’s uptick was truncated at the 3733.0 resistance, where the large falling wedge’s upper border lies. The resultant pinbar candle precedes the intraday decline. However, the bullish flag’s measured move is expected to complete at the 3800.0 psychological resistance. Therefore, the bulls must break above the wedge’s upper border and the 3733.0 resistance (20 January and 10 May highs). Additional barriers to the north include 3923.0 (27 October/6 December 2021 and 11 February 2021 highs) and 4030.0 (21 September 2021 and 10 December 2021 highs). The bulls’ additional price discovery in seeking out a measured move for the falling wedge will bring in 4189.5 (22 July/5 August 2021 highs) and 4372.5 (2/18 June highs).
On the flip side, an extension of the intraday decline targets the 3549.5 support (31 March high and 27 April low). Attainment of this level invalidates the bullish pennant. A breakdown of the 3549.5 support brings in 3442.5 (9-23 March highs in role reversal) and 3359.5 (25 March and 19 April 2022 lows). If the bulls fail to defend 3359.5, a decline towards 3193.0 (25 January 2017 low) looks certain. This decline would invalidate the large falling wedge pattern.
Unilever: Daily Chart
Follow Eno’s NFT Collection on Opensea.