The Turkish Lira slumped in early Monday trading, as Turkish President Recep Erdogan removed the erstwhile Governor of the Turkish Central Bank Murat Cetinkaya over a difference in opinion as to the direction of monetary policy. President Erdogan has been an advocate of lowering rates, saying that higher interest rates would lead to inflationary pressures. Cetinkaya had adopted a more cautionary stance, superintending over a June 12 monetary policy meeting which left rates unchanged, to the chagrin of the Turkish President and policymakers who backed President Erdogan’s stance.
Two issues will determine the value of the USDTRY in the months ahead.
- Will there be a rate cut or not?
- If yes, when will it happen?
The removal of Cetinkaya shows that the Turkish Central Bank is really not an independent institution but may just be an appendage of the central government, whose leadership continues to consolidate its hold on key structures of the Turkish state. The odds for a rate cut are now much higher, and this may happen much earlier than previously expected.
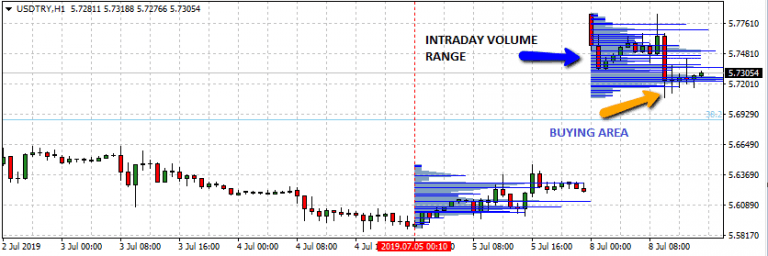
USDTRY Hourly Chart
USDTRY remains in a long term uptrend, despite the rally in recent weeks by the Lira. USDTRY traders would also be drawing some inspiration from the latest US jobs report. Friday’s strong jobs report may give the US Fed Reserve an impetus not to tow US President Trump’s line of aggressive rate cuts.
USDTRY has gapped strongly to the upside, but prices have eased a little. However, the volume profile for the USDTRY has identified 5.7201 as the intraday price area where lots of buy orders could come in. This is also the area where the USDTRY had found support on June 4, June 19, and June 21 as seen on the 4-hour chart. This area also corresponds to the 38.2% Fibonacci area, using a trace from the August 27 swing low to the July 2018 swing high.
USDTRY Daily chart
If the present intraday buying area located at the 38.2% price area holds firm, then we can see some short-term bullish push to the 6.2457 price area where a previous resistance was seen in October 2018 and which also serves as the 23.6% Fibonacci area. I suspect that traders will use the same level to book profits. While I think they will be willing to remain long and bullish below the long entry price of 5.7201.
If prices dip below the 5.7201 price area, this will invalidate the 38.2% Fibonacci level as price support and open the door for prices to head to the 50% Fibonacci price level of 5.2540, where previous support seen in November 2018 and January 2019.
Don’t miss a beat! Follow us on Twitter.