GRT crypto is the native token of the Graph network, a project known for indexing blockchain data from networks such as Ethereum and Filecoin. The Graph Network has long been compared with Google due to some of its functionalities, such as querying and indicating where the original data can be found.
The Graph project has become highly useful for blockchain developers looking for data or open-source projects. They can query data from multiple sources through Graph’s subgraphs, which help them query data inside these codes.
The Graph Price Prediction
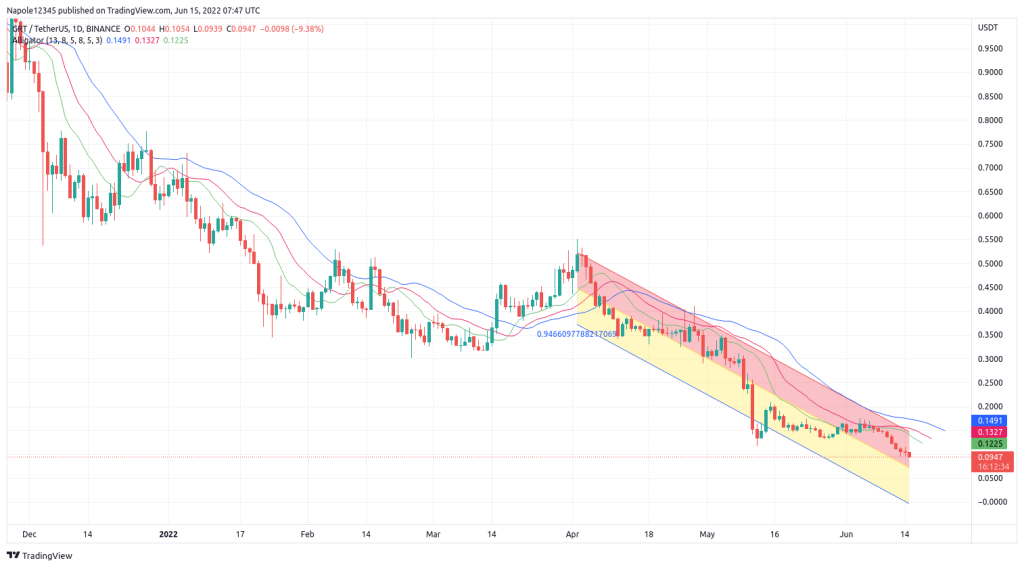
Today’s trading session has seen GRT drop by 7 per cent. The strong bearish trend is a continuation of the past eight days that have closed with price loss, resulting in a 39 per cent drop. The current bearish trend is also a continuation of a long-term trend that has persisted throughout the month and has seen the GRT price drop by 41 per cent.
The June GRT price drop has also been a continuation of a long-term trend that saw the crypto lose 46 per cent of its value in May and 34 per cent of its value in April.
Looking at the year-to-date price history, GRT is down by 85 per cent. This is an indication of the strong bearish trend that has persisted since the crypto hit its all-time price high of $2.88 on February 12, 2021. Since then, GRT prices have lost more than 96 per cent of its value and is currently trading at $0.096.
The above price history background offers us a clear perspective of what has been happening in the markets for years. Therefore, GRT price prediction expects the current strong bearish trend to continue. As a result, there is a high likelihood that we will see the crypto continue to set new yearly price lows. It is also possible that the current bearish trend might see the prices trading below the $0.0800 price level.
However, my analysis will be invalidated if the prices reverse and trade above the $0.15 price level. At that point, it will be clear that the trend has reversed, and we are looking at a GRT price recovery.
GRT Daily Chart