The Tesco share price is up 1.56% on the day as the stock tries to break from its recent free fall as the cost-of-living crisis impacts UK households. The Tesco share price has not had a good year. This became evident several months back when Nielsen and Kantar, two firms involved in researching the retail segment of the UK economy, warned of the impact of rising inflation on UK retail companies and supermarket outlets.
NielsenQ’s latest report shows that 57% of UK consumers had been severely or moderately impacted by the cost-of-living crisis, with this figure expected to rise to 76% in three months. This is as inflation is expected to exceed the Bank of England’s previous target by the end of the year.
NielsenQ’s Mike Watkins, who heads the firm’s retail and business insight division, said that the focus of most households was on their weekly grocery expenses, with a lot of shopping around going on to get the best possible savings to balance household budgets.
Supermarket sales in the week ended 10 September showed the lowest levels since Easter. In the four weeks leading up to that date, UK supermarket sales fell by 400 million pounds annually as UK shoppers spent less than at the start of Autumn in 2021.
Tesco’s sales rose 3.6% within this period, but it has lost its leadership position to Lidl, whose sales were up 9.4% year-on-year. The Tesco share price may have gained on the day, but this is more of a rally within weakness.
Tesco Share Price Forecast
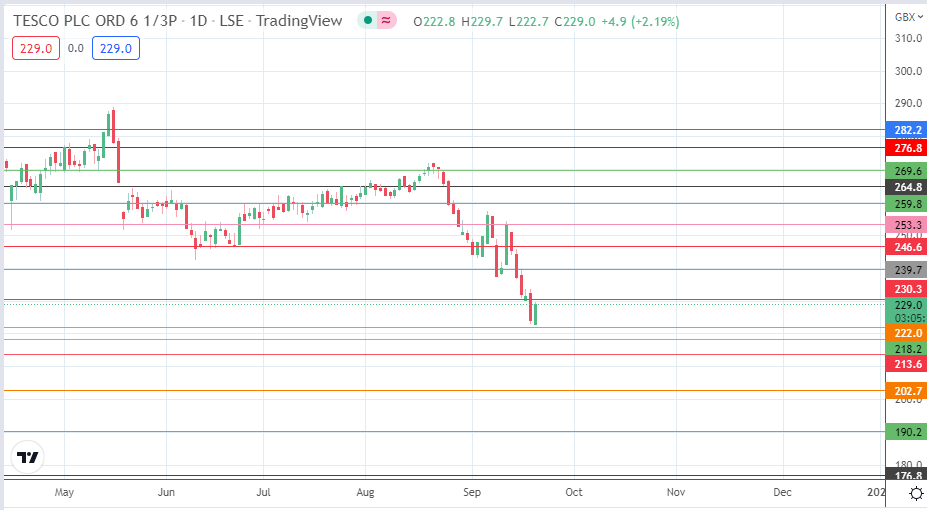
The intraday bounce has met resistance at 230.3. An advance to 239.7 (15 September high) has to follow a break of 230.3. There are additional upside targets at 246.6 (23 June low) and 253.3 (12 September high) if the bulls uncap the barrier at 239.7. An uptrend reversal follows a break of the 269.6 resistance level.
On the flip side, a breakdown of 222.0 () continues the downtrend move. This could come from a rejection at any of the resistance barriers mentioned above. If 222.0 gives way, 218.2 becomes the next downside target. 213.6 (4 September 2020 low) and 202.7 (28 October 2020 low) become additional harvest points for the bears on a continued price deterioration.
TSCO: Daily Chart