The Supply@Me share price continues to flounder in Friday’s trading. After losing 6.67% on Thursday, the stock has had a flat opening to the day’s session. Presently, the stock is down 14.82% for the week after the bears rebuffed attempts to break the 0.0900 resistance.
Despite attracting new funding from VeChain to the tune of $10 million, the stock has found it hard to generate bullish momentum, trading within the range that constitutes the rectangle pattern on the daily chart.
The strategic partnership that Supply@Me signed with VeChain will enable it to establish a Web3.0 imprint as it seeks to merge its inventory monetization with traditional finance within the blockchain environment. The company hopes to execute its first proof-of-concept transaction in July while scheduling the development of its inventory monetization platform 3.0 by the end of the year.
The Supply@Me share price continues to consolidate and could provide trading opportunities for range traders in the absence of fundamentals that could trigger a breakout.
Supply@Me Share Price Forecast
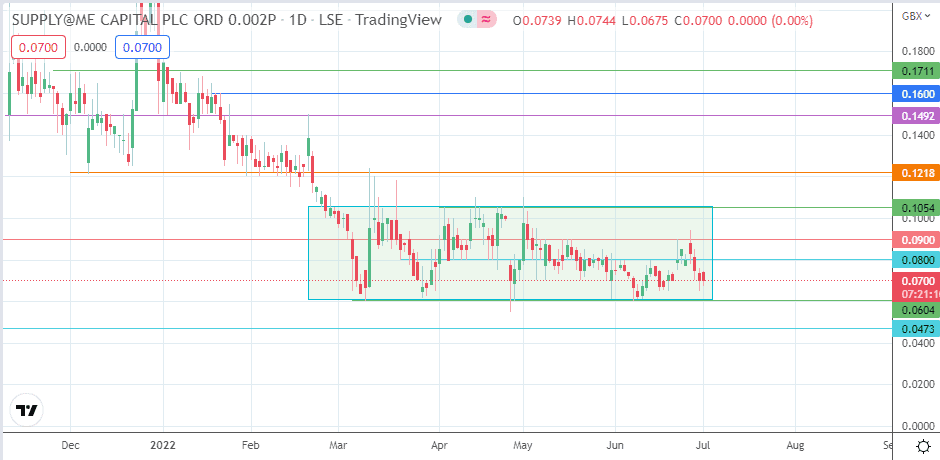
The price action remains range-bound, with the price now heading to the lower border of the rectangle at 0.0604. A bounce at this level targets the 0.0800 resistance (11 April low, 5/16 June highs). A break above this level aims for the 16 May/23 June highs at 0.0900.
The rectangle’s upper border comes up next on a further advance, with the 0.1054 resistance marking this point as the intervening barrier between the bulls and the 0.1218 resistance (10 March 2022 high). 0.1492 (18 February 2022 high) and the 20 January 2022 high at 0.1600 form additional barriers to the north.
On the flip side, a breakdown of the 0.0604 support allows the bears to target the 0.0473 support (5 August 2020 high). This price mark and the 30 July low at 0.0413 serve as the only barrier preventing the bears from pushing to new record lows. The pattern preceding the rectangle is a downtrend, and this setup favours the bearish outlook.
SYME: Daily Chart