The S&P 500 index is bracing for major moves on Wednesday as the Fed delivers its first decision of the year. It, together with other American indices like the Nasdaq 100 and Russell 2000, will also react to the earnings dump by some of the biggest and most influential companies in Wall Street. Some of the top firms that will publish their results this week are Altria, Apple, and Meta Platforms. The S&P 500 index rose to $4,076 on Tuesday, a few points below the year-to-date high of $4,095.
S&P 500 index forecast
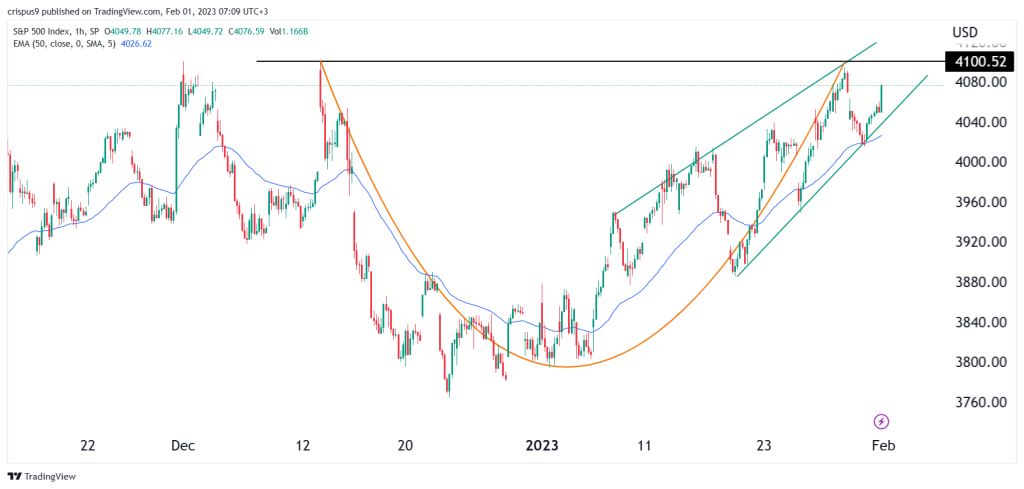
The main goal of this article is to map up likely scenarios after the Federal Reserve decision and the important corporate earnings. The hourly chart shows two distinct patterns that will have an impact on the S&P 500. First, the chart has formed a rising wedge pattern that I have shown in green. This wedge has been developed by connecting he lowest levels since January 19 and the highest points since January 13. In most cases, this pattern is usually a sign of a reversal when the two lines near their confluence points.
The S&P 500 index has also formed a cup and handle pattern. Unlike the rising wedge, this one is usually a sign of continuation, which is usually confirmed when it rises above the upper side of the cup. It seems like the index has already formed the cup part and is now in the handle section. Another supportive factor is that gold has moved above the 50-period moving average.
Therefore, from the hourly chart standpoint, I think that the bullish momentum that we saw in January is still on. As such, I can’t rule out a situation where the S&P 500 index rises to $4,500 and above. On the flip side, a drop below the support at $4,015 (Jan 30 low) will invalidate the bullish view.
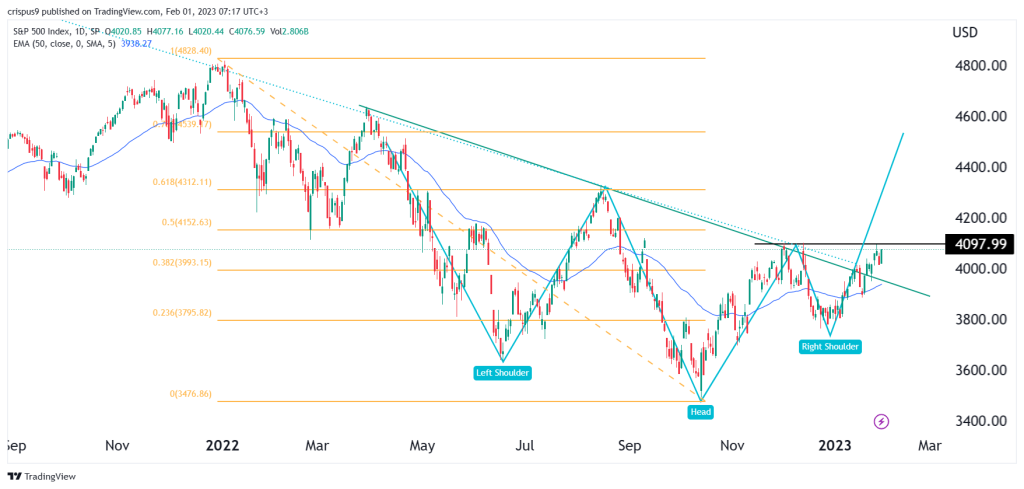
SPI 500 daily chart analysis
On the daily chart, we see that the S&P 500 index has been attempting to recover after it slumped to a low of $3500 in October last year. This rebound has seen it rise by more than 16%, meaning that it is yet to get to a bull market. The index has also formed two patterns. A closer look shows that it is forming a double-top pattern at $4,097 whose neckline is at $3,767. It is usually one of the most accurate reversal patterns.
S&P 500 has also formed an inverted head and shoulders pattern. This pattern is a sign of a bullish reversal since the price has moved above the neckline. Therefore, for a clear prediction, we need to see the price move above the double-top section at $4,097. If this happens, the next key level to watch will be the 61.8% Fibonacci Retracement level at $4,300 followed by the next point at $4,500.