
The bloodbath on the S&P 500 has finally stalled, as the index opened higher this Wednesday. The rout in the technology shares abated as the tech index gained 2% to fuel a decent 1% recovery at the time of writing.
All 11 subsectors on the S&P 500 are trading higher, as risky sentiment returns to the market. This is despite the pause in further clinical trials of its coronavirus vaccine candidate by AstraZeneca, in what is a major blow to the fight against the coronavirus.
The S&P 500 is now at a crossroads, as many analysts are predicting further correction down the road. Yahoo! Finance is reporting Mike Wilson, a Morgan Stanley strategist, as saying that the bank “thinks there is more downside over next month”…which leads to further broadening out of the bull market.” This sentiment is echoed by others, as the tech index component of the S&P 500 starts to show vulnerability.
The S&P 500 Index currently trades at 3402.1, or 2.11% higher at the time of writing.
Technical Outlook for S&P 500
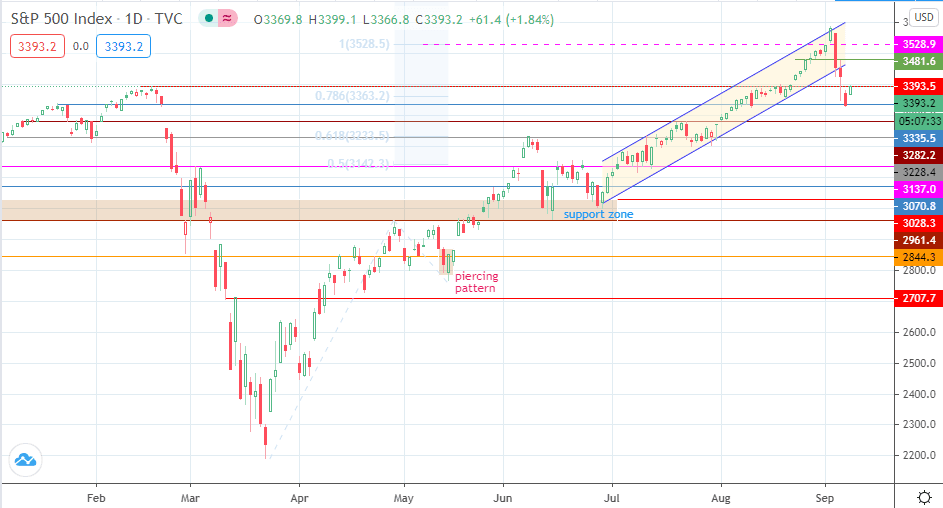
Today’s candle shows a strong bid for the S&P 500 index. However, it has encountered resistance at the 3393.5 price area. It needs to break this price level to be able to target the 26 August and 4 September highs at 3481.6. The 3528.9 resistance lies above this area, and it is the only price barrier that stands in the way of a retest of the all-time high of 3588.1. Price would need to form a high above this all-time high to resume the uptrend on the index.
Conversely, rejection at 3393.5 and a pullback from that level could allow the index’s sellers to retest the 3335.5 support, with 3282.2 and 3228.4 lining up as the next support levels in view. Even if price scales 3393.5, the lower border of the ascending channel may mount a resistance, as it intersects the 3481.6 price resistance ahead.
Don’t miss a beat! Follow us on Telegram and Twitter.
S&P 500 Daily Chart
More content
- Download our latest quarterly market outlook for our longer-term trade ideas.
- Follow Eno on Twitter.
- Do you enjoy reading our updates? Become a member today and access all restricted content. It is free to join.