
The contagion from the tech selloff on the Nasdaq 100 is rubbing off on the S&P 500 index, with sellers regaining control after an initial higher opening. The S&P 500 index is currently trading at 3379.8, a drop of 2.17% on the day as at the time of writing. By this move, the S&P 500 is having its worst trading day since June and looks close to ending its 5-week winning streak.
Today’s NFP result was mixed, as the larger-than-expected drop in the unemployment rate was offset by the failure of employment change to match the market expectation of 1375K jobs. The reading of 1371K job additions was lower than the previous figure, which was not enough to stop the selloff after markets had risen so much and so fast without accompanying fundamentals to back up these moves.
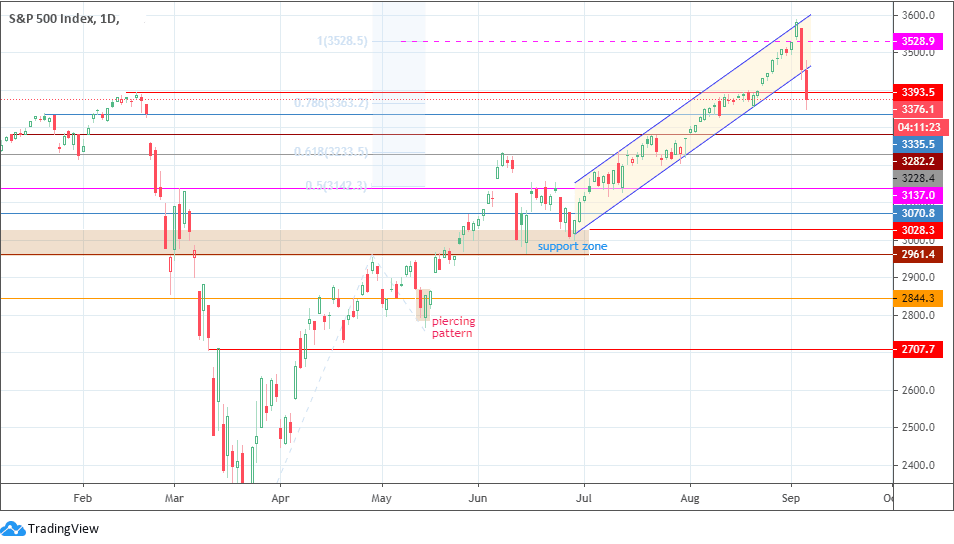
Technical Outlook for S&P 500
The price candle for the day has effectively smashed through the channel’s lower trend line with a 3% penetration. If the candle’s close meets this penetration target, we may not need to see a second daily close below the channel’s lower border to confirm the breakdown of that price level. However, a second successive daily penetration close below 3393.5 provides additional confirmation of the collapse of that support. This opens the pathway towards the 3335.5 support target, with 3282.2 and 3228.4 being the next targets to the south that may regain relevance to the decline.
On the flip side, a failure to confirm the break of 3393.5 may allow for a bounce and retest of the channel’s lower border. However, any further uptrend on the S&P 500 depends on re-establishment of higher highs above 3528.9.
Don’t miss a beat! Follow us on Telegram and Twitter.
S&P 500 Daily Chart
More content
- Download our latest quarterly market outlook for our longer-term trade ideas.
- Follow Eno on Twitter.
- Do you enjoy reading our updates? Become a member today and access all restricted content. It is free to join.