The S&P 500 is looking fragile and using data from June 18, we can see that the price has carved out a head and shoulders pattern in the one-hour chart. I usually, don’t pay attention to short duration patterns in the one hour as they can easily morph into something different, yet the latest pattern has formed just below the 2019 high. And, as most of you might know, the 2019 high is just a bit higher than the 2018 high so one could argue that the S&P 500 is in the process to carve out a double top around 2965. A similar index, the Dow Jones 30, is struggling with a triple top.
If the pattern was not forming below an important resistance level it would have less value, but today it is hinting that the S&P 500 might be on its way to leave the 2019 high area.
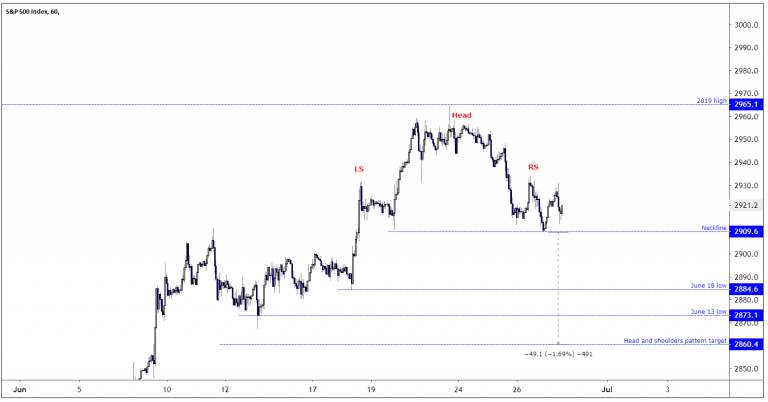
For the smaller head and shoulders pattern to trigger, the price will need to slide below yesterday’s low of 2909.6, as doing so will cause the price to trade below the “neckline” of the pattern. On a successful break to the neckline the price should decline to the first support level at the June 18 low of 2884.6, followed by the June 13 low at 2873.1, to ultimately reach the pattern objective at 2860.4.
The biggest risk to trading this pattern, is that it is short-term in nature and these patterns has a lower reliability rate than patterns on the daily chart. Other risks, are comments by officials at the important G20 meeting. The market is hoping for signs of a truce in the U.S.-Sino economic war, yet comments so far don’t suggest that a breakthrough is imminent. Early, next week we will know the outcome of the talks between the U.S. and Chinese leaders. A truce can send stock markets higher, while a standstill or deteriorating relationship between the two superpowers should send stock markets lower.Don’t miss a beat! Follow us on Twitter.