A strong financial showing in the third quarter of 2021 has impacted positively the SNDL stock forecast. Although today’s trading session is showing a drop in the value of the stock and the last few weeks have been bearish, the outlook is looking positive.
SNDL Financial Reports
SNDL had a very positive financial showing in the third quarter of 2021, recording a net income of $8.98. This was a huge increase from the second quarter of 2021, when the company recorded a loss of $42.59 million. The financial records also showed that the company’s balance sheet had assets worth $1.15 billion and total liabilities of $66 million. They also had a very healthy debt to asset ratio of 5.75 per cent.
Growth of SNDL Stock Price
Much of Sundial Growers’ (SNDL) growth during the beginning of last year was due to meme investment. This is when investors prop up an undervalued stock, making it surge in price, and hence appears as if the growth is arising from fundamental and technical analysis. Unfortunately, the hype around the company appears to have faded in the past few months. This has led to the company trading below a dollar.
SNDL Stock Forecast
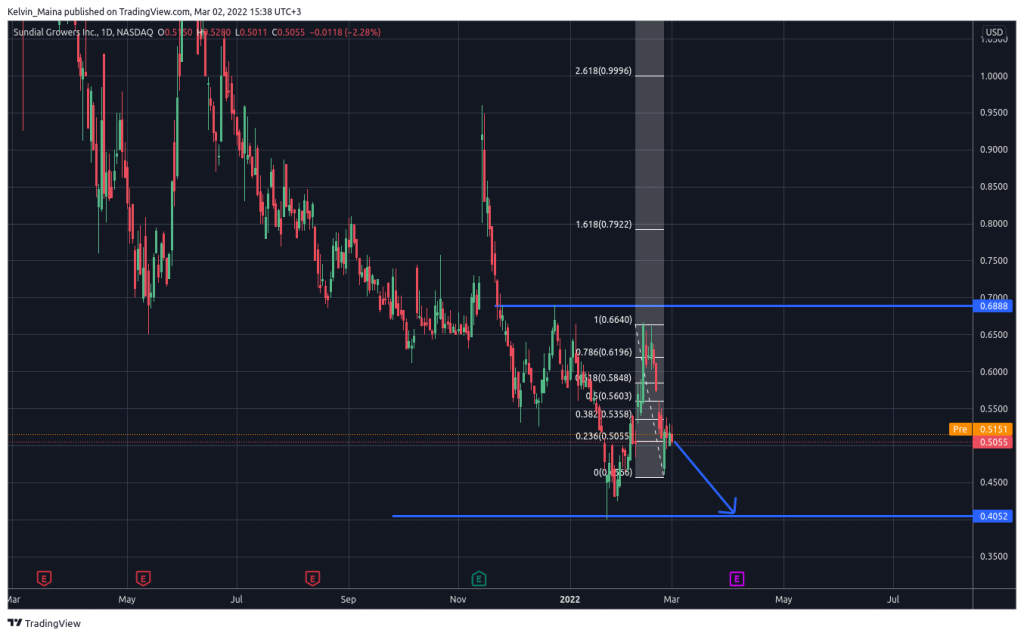
SNDL prices failed to hit the resistance level of 0.68 on February 11th, and the prices started to trade downwards. Since then, the prices have displayed a bearish pattern. In today’s trading session, this bearish pattern has continued, with the SNDL stock losing more than 2 per cent.
Looking at the daily chart below, my SNDL stock forecast expects the prices to continue falling. This is based on Fibonacci analysis, which shows that the recent gains are due to retracements. The recent one hit a 38 per cent retracement level of the Fibonacci indicator. Therefore, I expect the prices to hit the $0.40 support level. However, if the prices move past the 50 per cent retracement level of Fibonacci, then my trade analysis will be invalidated. It will also mean there is a reversal to the upside.
SNDL Daily Chart