Shiba Inu prices have dropped by more than 12 per cent in the past five days. Today’s trading session is also marking a third consecutive session where the prices are looking highly likely to close below the opening prices.
Despite the current long-term bearish trend, Shiba Inu’s fundamentals have been very strong and positive. In the past few days, the cryptocurrency has seen its prices jump by more than 20 per cent in a single day. This was after the news reported that Shiba would be listed in the Robinhood application.
The announcement sent the cryptocurrency in a frenzy, resulting in a more than 35 per cent price gain within a trading session. However, the prices would later drop and close the markets at only 21 per cent. Since the announcement, however, the prices have increasingly become bearish, with prices reducing by 19 per cent since the surge set a resistance level of $0.00003.
The past 24 hours have seen the trading volume of Shiba Inu reach $588 million. This is a 69.31 per cent increase from the previous day. Although the sharp increase in trading volume has not been reflected in the prices, it is likely that there are other factors that are resulting in the price of Shiba Inu going downwards.
Shiba Inu Price Prediction
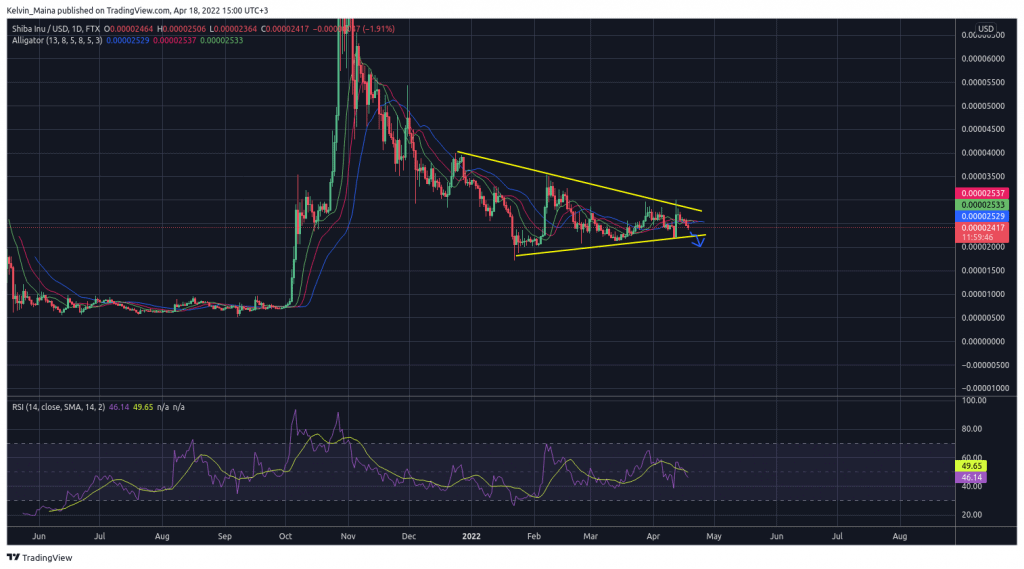
Looking at the daily chart below, we can see the prices hitting the upper trendline of the triangle chart pattern. We can also see the prices starting a new downward trend. Although the Williams Alligator shows reduced volatility in the market, the indicators still show the market is still bearish. This is confirmed by the RSI indicator which also sees the prices are bearish.
Therefore, by combining both indicators and price action analysis, I expect the downward price movement to continue. I also expect the prices to hit the lower trend line of the triangle. At this point, there is a high likelihood of a trend reversal due to the Triangle pattern formed, presenting a buying opportunity. However, it is also possible that the prices will push downward once the prices hit the lower trend line of the triangle pattern.
Shiba Inu Daily Chart