The sharp drop in the GBPUSD over the last few days has triggered a resumption of the bullish trend in the FTSE 100 index.
Most FTSE 100 firms derive their income from outside of the UK and converting their profits in foreign currency back into GBP boost the value of the firms and the FTSE 100 index.
As an example, in Dollar terms, the FTSE 100 is still about 32% below its all-time high set in 2007, while on GBP terms the index is up by 13.16% from the same 2017 high. The strong performance in the FTSE 100 could, therefore, be partially explained to weakness in GBPUSD rather than the FTSE 100 firms outperforming. Another metric is the correlation coefficient between the FTSE 100 and the GBPUSD, and it stands at negative 0.76 for a sample size of the last 30 days. This means that for every percent that the FTSE 100 rises the GBPUSD will slide by 0.76%.
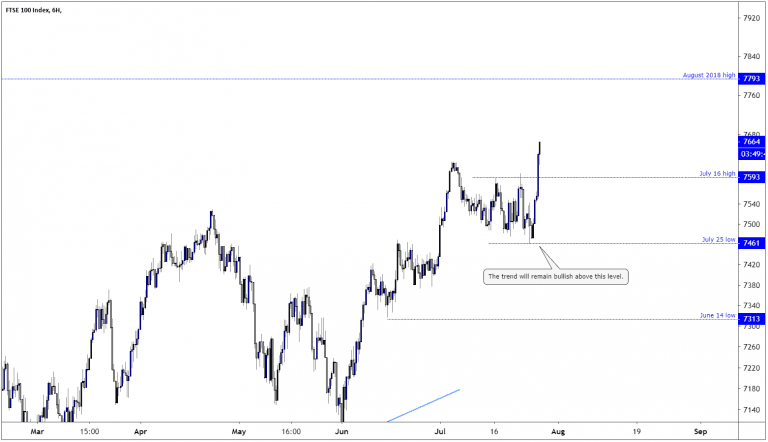
As for the technical outlook, the FTSE 100 trend is once again bullish as the price took out the July 16 high of 7642, a level we pointed out as important in my July 22 update: FTSE 100 Remains Capped By July 16 High.”
The short-term trend will now be treated as bullish above the July 25 low of 7461, and traders will probably see any declines to the July 16 high as corrective and pause in the uptrend before reaching the August 2018 high of 7793.Don’t miss a beat! Follow us on Twitter.
Download our latest quarterly market outlook for our longer-term trade ideas.
Do you enjoy reading our updates? Become a member today and access all restricted content. It is free to join.