The completion of the key pattern on the daily chart has helped to stave off further Rivian stock price predictions. The Rivian stock price is up 2.2% on news that the state of Georgia plans to provide the company with billions of dollars in financial incentives to move ahead with its second manufacturing plant.
Rivian Automotive Inc had announced plans to set up a second manufacturing facility in Georgia to keep up with increasing demand for its alternative use electric vehicles. However, pushback from locals stalled the project. Now, Georgia is promising $1.5billion worth of tax breaks and other financial incentives if it fast tracks the project.
There is a previous precedent to this move. KIA Motors had enjoyed a similar package from the state in 2006. The state’s offer to Rivian is not without clauses. The company must meet an 80% employment target by 2028 and must sustain investment and employment milestones for the next 25 years.
The Rivian stock price was up initially by 6% in Tuesday’s trading, but some pushback from the bears has seen the stock give up some of its gains. The Rivian stock price prediction based on the 12-month price target of fourteen institutional analysts sees the stock trading at a median of $81. High and low price points of $112 and $25 have been given, with the median offering the potential for a 56.79% upside.
Rivian Stock Price Prediction
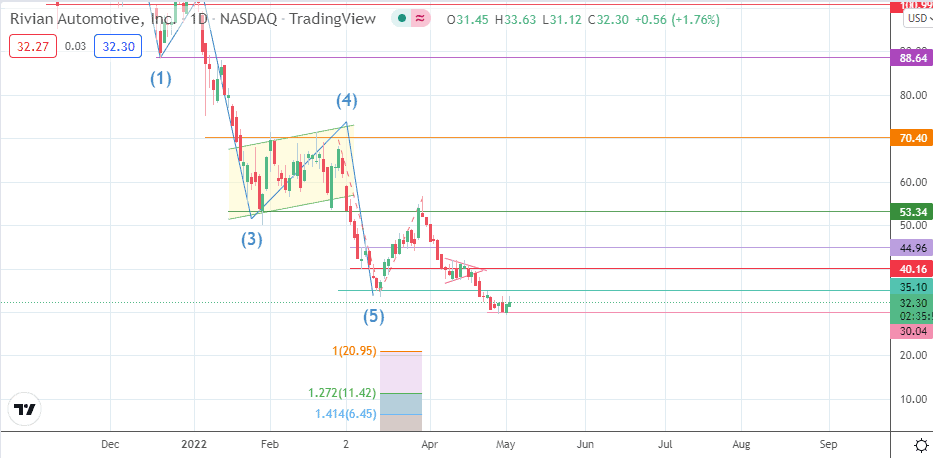
The price activity has found support at the 30.04 price mark, following the completion of the bearish pennant. The bounce on the 30.04 support level (29 April low) puts the price activity on course to target the 35.10 price resistance (25 April 2022 high). A further advance that uncaps the 35.10 resistance targets the 40.16 barrier (18 April 2022 high). 44.96 is another barrier to the north before the resistance levels at 53.34 (24 February low in role reversal) and the 70.40 price mark (2 February high) come into the picture as additional upside targets.
On the other hand, 20.95 and 11.42 are potential price targets to the south (100% and 127.2% Fibonacci extension levels) that come immediately into the picture if there is a price decline below the 30.04 support. An additional slump brings 6.45 (141.4% Fibonacci extension level) into the mix.
Rivian: Daily Chart