
Ripple price (XRPUSD) is little changed today as investors wait for the Federal Reserve interest rate decision. The price is trading at $0.2435, which is slightly above the day’s low of 0.2345. Other digital currencies are also little changed in the past 24 hours, with Tether, Bitcoin Cash, and Binance Coin falling by less than 1%.
Ripple, and other cryptocurrencies, have been under pressure in the past two weeks. That has seen the market capitalisation of the leading digital currencies drop to more than $347 billion. This decline has happened because of three main reasons.
First, it dropped after a strong rally, which sends a signal that it was because of profit taking. In the past, such strong rallies tend to lead to a sharp correction as investors take profits. Second, Ripple price has struggled partly because of the actions in the currency market.
Last week, the dollar index continued to rally mostly because of the stronger data from the United States. This week however, the index has declined ahead of the Fed decision. This price action of the dollar has helped provide some support to Ripple and other digital currencies.
Third, Ripple price fell because of the overall weakness in the financial market. In the past two weeks, global stocks have been relatively volatile after it emerged that Softbank was responsible for the previous tech rally. In the past, digital currencies tend to fall sharply immediately when stocks fall.
So, what next for the price of Ripple?
Ripple price technical outlook
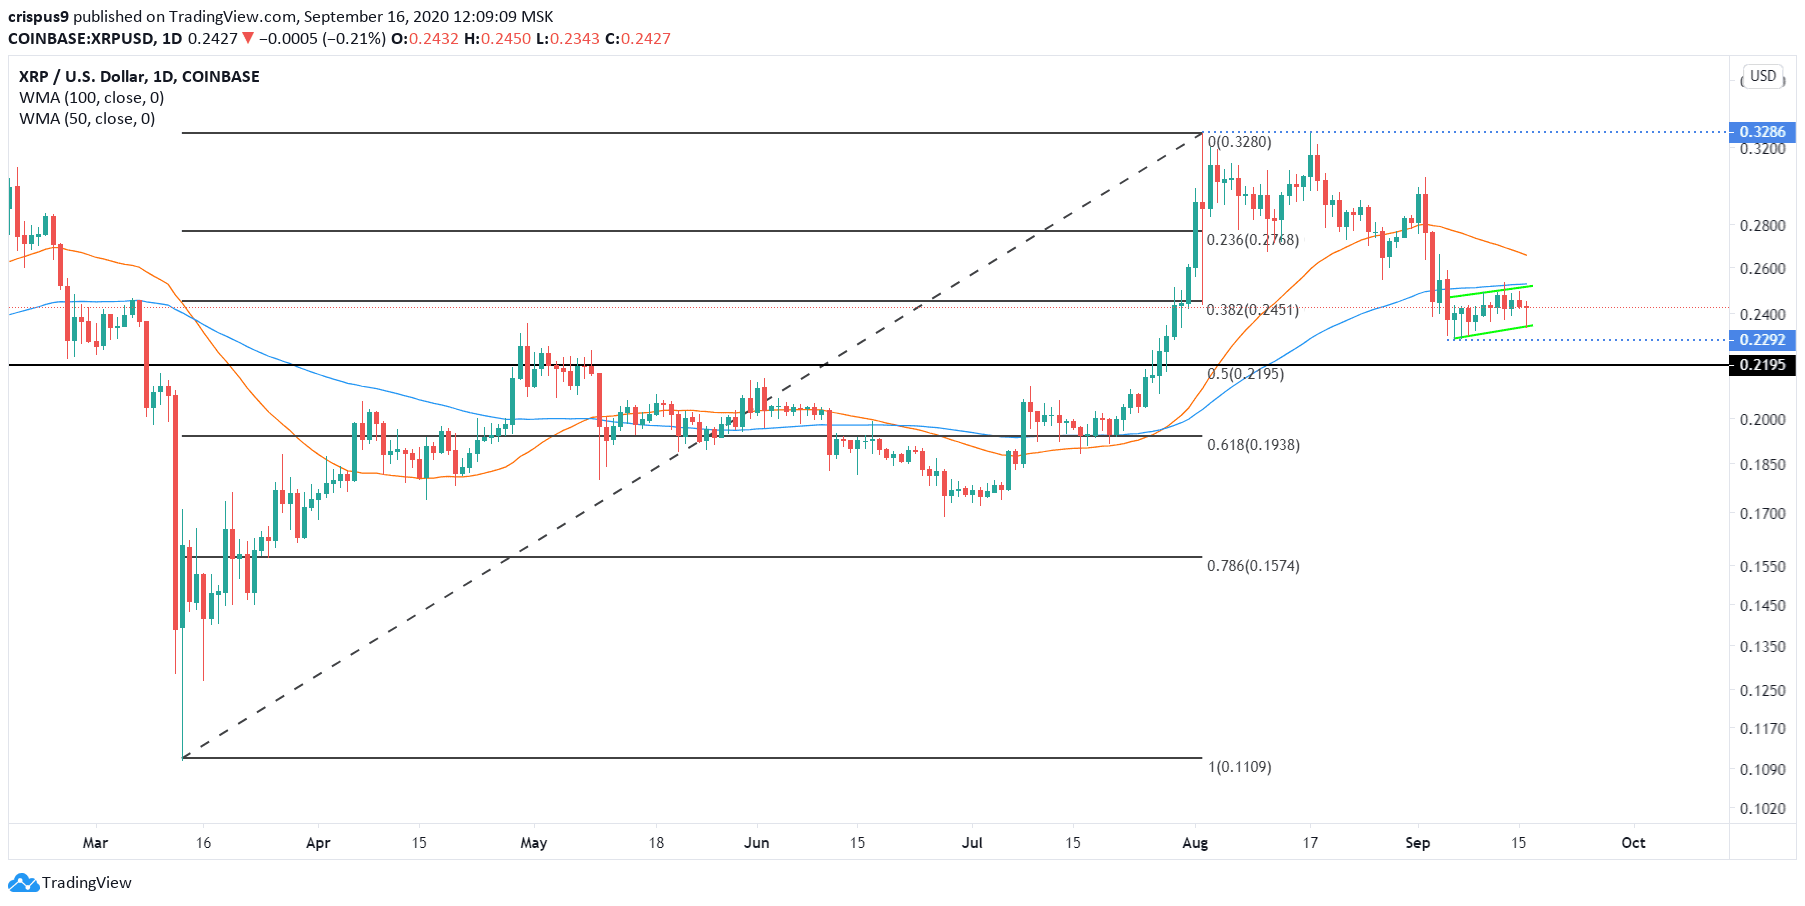
The daily chart shows that Ripple price fell from the double-top level of $0.3286 on August 17. It reached a low of $0.2292 on September 4. Since then, it has attempted to pare back some of the previous losses. By so doing, the pair has formed what seems to be a bearish pennant pattern that is shown in green. It is also along the 38.2% Fibonacci retracement level and still below the 50-day and 100-day weighted moving averages.
For this reason, I believe that Ripple will resume the downward trend as bears attempt to move below the 50% retracement at $0.2195. On the flip side, a move above the 23.6% retracement at $0.2768 will invalidate this trend.
Start your trading journey with our free forex trading course and one-on-one coaching by traders and analysts with decades of experience in the industry.
Don’t miss a beat! Follow us on Telegram and Twitter.
XRPUSD technical outlook
More content
- Download our latest quarterly market outlook for our longer-term trade ideas.
- Follow Crispus on Twitter.
- Do you enjoy reading our updates? Become a member today and access all restricted content. It is free to join.