
Ripple price (XRPUSD) is up by more than 1.85% today as traders react to the overall weaker US dollar. The currency is trading at $0.24, which is slightly higher than this week’s low of $0.2300. Other digital currencies are also rising, with Ethereum, Bitcoin, and Chainlink rising by 5.25%, 1%, and 2.50%, respectively.
Like all other cryptocurrencies, the price of Ripple has been under pressure lately. It has fallen by more than 8% in the past seven days. Last week’s decline was part of a major correction that affected most financial assets like stocks and commodities.
Still, the case for Ripple has been increasing recently. For one, the amount of money being sent across the borders has continued to rise. That is in contrast to what the World Bank warned in April, when it predicted that the remittances would fall by more than 20% this year.
In a note yesterday, Ripple explained the role of blockchain to cross-border transactions. The note explained how Ripplenet’s on-demand liquidity (ODL) is helping solve the most pressing problems when it comes to these transactions. He said:
“To solve this, Ripple has developed a solution called On-Demand Liquidity (ODL) which uses the digital asset XRP to enable funds to be sent to destination accounts immediately – literally on-demand, rather than days beforehand.”
This note came a few days after a report by Fidelity showed that 80% of institutional investors were enthusiastic about digital assets.
Ripple price technical outlook
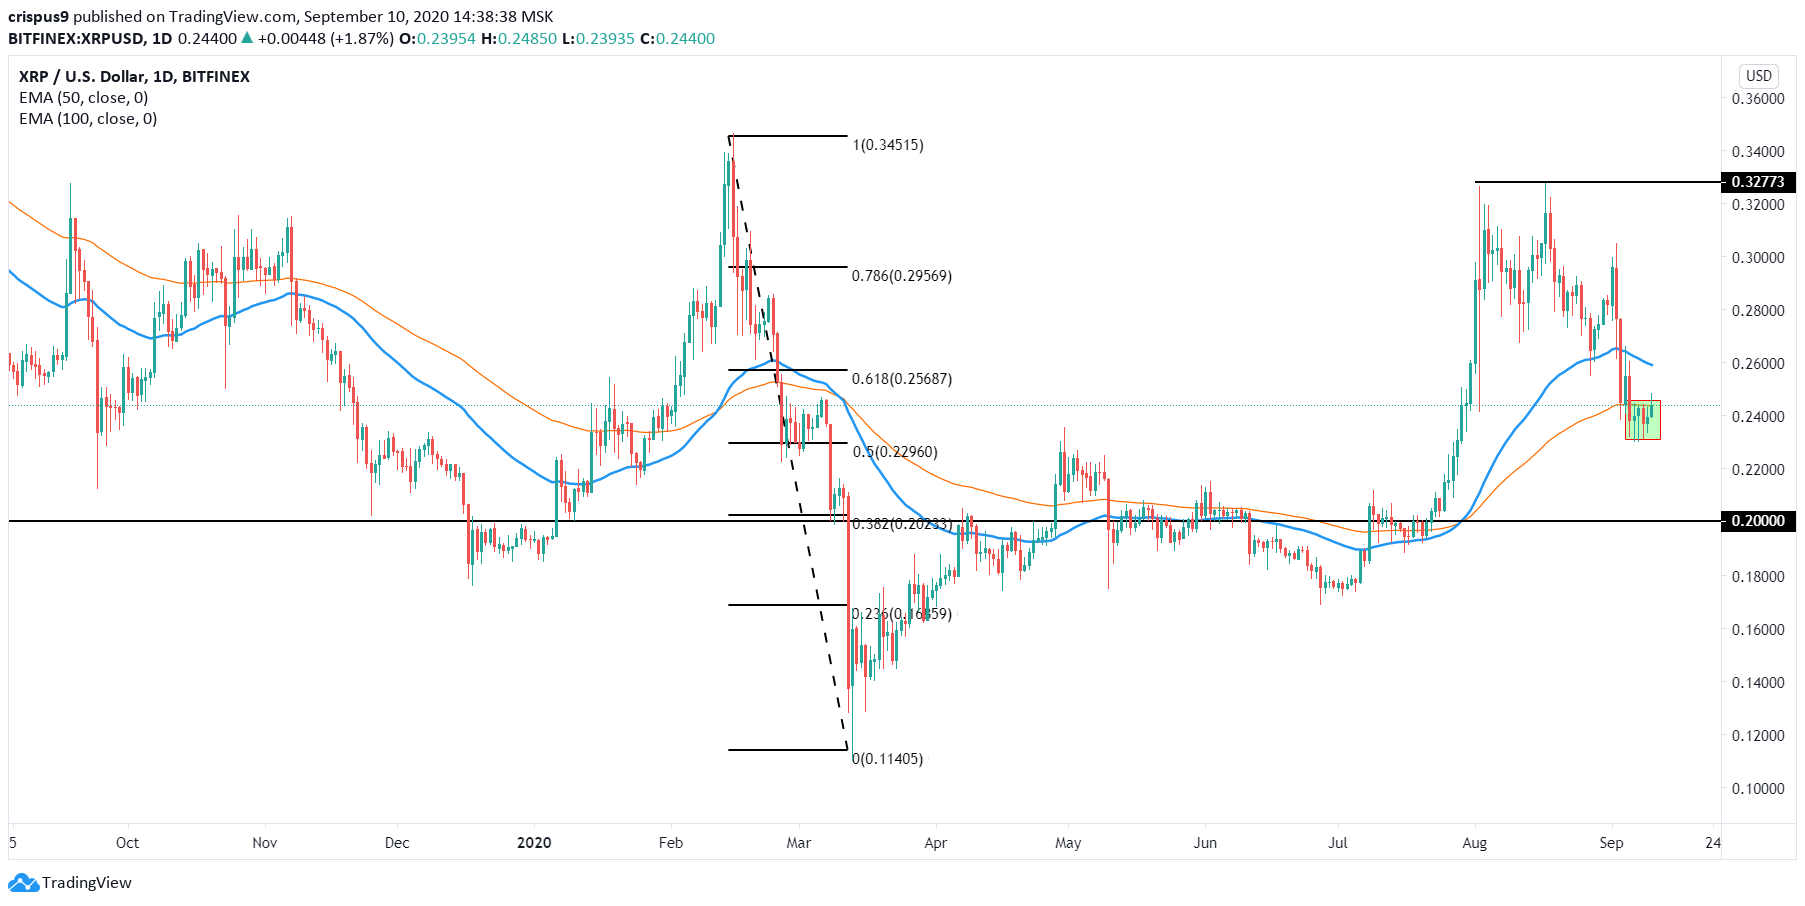
The daily chart shows that Ripple price dropped to a low of $0.2293 last week. A closer look at this chart shows that this decline was not accidental. It happened a few days after the currency formed a double top pattern at $0.3277. Now, the price is along the 100-day exponential moving averages and below the 50-day EMA. At the same time, it has formed a bearish consolidation pattern that is shown in green.
Therefore, as I predicted in my Bitcoin note earlier today, I suspect that the price will break out lower as bears target the next support at $0.2000. On the other hand, this prediction will be invalidated if it moves above the 50-day EMA at $0.2600.
Do you want to be an excellent trader? Register for our free forex trading course and one-on-one coaching by traders with decades of experience in the industry.
Don’t miss a beat! Follow us on Telegram and Twitter.
Ripple price technical chart
More content
- Download our latest quarterly market outlook for our longer-term trade ideas.
- Follow Crispus on Twitter.
- Do you enjoy reading our updates? Become a member today and access all restricted content. It is free to join.