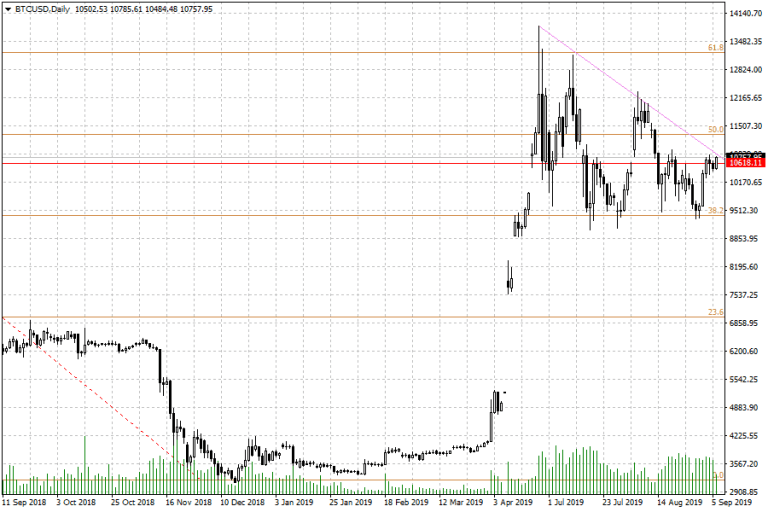
BTCUSD continues to find it impossible to break the 10,620 horizontal resistance line. The support and resistance areas for BTC are defined on the charts by the Fibonacci retracement levels derived from a trace from the November 2018 swing high to the December 2018 swing low. The horizontal resistance area within the triangle at 10,620 has continued to remain valid for several weeks now.
Looking at the total picture, we can see that the descending trendline is starting to interact with this key level, as the descending triangle on BTCUSD continues to evolve towards completion.
Technical Play for BTC
Information credited to BEINCrypto suggests that a BTC whale has moved a significant stash of BTC from several sources into a single wallet. If whales that hold massive amounts of BTC start to offload their holdings into the market, this may impact prices.
Technically speaking, failure of BTCUSD to break the 10,620 barrier decisively could open the door for a pullback to the 9400 once more (lower border of the triangle).
On the flip side, any news that causes BTC to breach present levels to the upside will take it above the descending trendline resistance and invalidate the previous downside move. This then opens the door for a possible test of 12,300, 12,500 and 13200, in that order.Don’t miss a beat! Follow us on Telegram and Twitter.
Download our latest quarterly market outlook for our longer-term trade ideas.
Do you enjoy reading our updates? Become a member today and access all restricted content. It is free to join.