
The recent drop in crypto prices continues to fuel bearish Polkadot price predictions. With price action failing to form clear trends, a microscopic look at ultra-lower time frames is required to check for the existence of any trading opportunities.
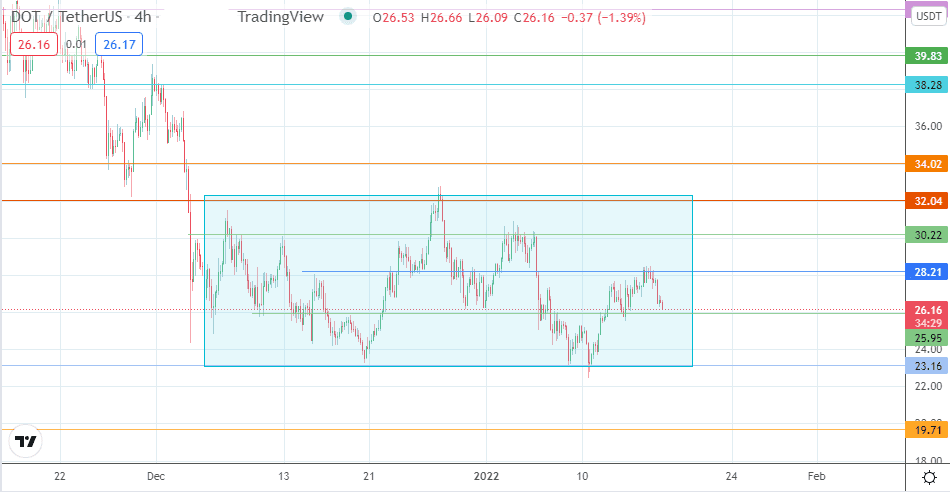
A look at the 4-hour chart shows that price has been trading in a sideways trend, with a rectangle pattern clearly visible. This pattern also showcases several areas where support and resistance levels have formed.
The recent price action on the 4-hour chart shows that the price has been trading between the range formed by 32.04 above, and 23.16 below. There are intervening support/resistance levels, with the most recent being the 28.21 price mark where bears resisted price action. Price is now approaching support at 25.95.
Polkadot Price Prediction
A breakdown of this level allows the DOT/USDT pair to aim for the 23.16 range boundary. 24.00 may serve as a pitstop. Only when the price drops below the range’s floor will a run towards 19.71 become actualized.
On the other hand, the bulls need to push price action above 28.21 for 30.22 to come into view as the initial target. Above this level, the upper range boundary at 32.04 becomes visible before 34.02 and 38.28 become the additional targets to the north if price action clears above the range’s ceiling.
DOT/USDT: Daily Chart
Follow Eno on Twitter.