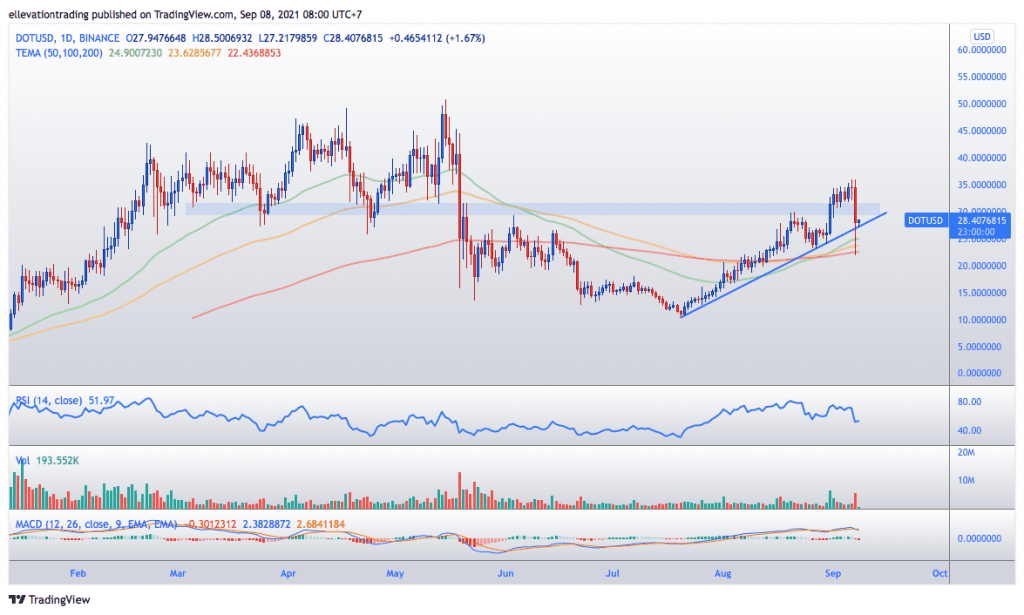
The Polkadot Price Slid 40% to the steepest intraday loss since the May crypto Collapse. However, DOT is fighting back, but will it last? Well, so far, so good. Polkadot (DOT/USD) has recovered the major moving averages and managed to claw its way back into an uptrend. However, yesterday’s vicious ‘flash crash’ serves as a stark reminder to investors that Crytptocurrency trading is not for the faint-hearted. Furthermore, in my experience, selloffs such as yesterday’s are rarely ‘one-hit wonder’s and often lead to more selling in the days that follow.
There are several reasons for yesterday’ crypto puke doing the rounds on social media. Firstly, yesterday was the historic launch of Bitcoin (BTC/USD) as a legal tender in El-Salvador. The IMF and the Bank of International settlements (BIS), which serves as the central bank to central banks, yesterday expressed disappointment in the South American nation. Did this cause a ‘sell the fact’ event? Possibly. However, those with a ‘tin foil hat’ disposition have even suggested this was a concerted effort to punish El-Salvador for breaking away from Fiat currencies. If that was the case, it failed. Nayib Bukele, the El-Salvadorean president, took to Twitter to tell his followers he was buying the dip. As a result, BTC started to reverse its 17% decline, bouncing from $43,00 to $47,000. This led to a surge of buying across altcoins, and the Polkadot price rallied from $22.02 to $27.94. The question is, does DOT continue yesterday’s sell-off or yesterday’s recovery?
DOT/USD Price Forecast
Up until yesterday, the Polkadot price had been respecting an uptrend in place since the July lows. However, the meltdown pushed the price below the trend line at $26.56. Furthermore, as the selling accelerated, DOT slipped below the 50-day moving average at $24.89, the 100 at $23.62 and the significant 200 DMA at $22.43. This constituted a serious deterioration in the technical outlook.
However, the Polkadot price was back above the moving averages and the significant trend by the close. And If DOT stays above the trend today, it will show incredible resilience and signal the uptrend is intact. In this event, the bulls will be encouraged, and the price should clear the recent high of $35.95 in the coming sessions.
The flip side is that the price turns negative today, losing trend support and working its way back to the moving averages. This would set the Polkadot price up for an even steeper decline. Should this be the case, the price finds support at the moving averages once again. However, if the 200-day fails to reverse a second test, the bulls will likely run for cover, sending DOT cascading even lower.
Yesterday was certainly significant. But I think it’s today that will tell us much more about whether the cryptomarket can continue its second bull run of 2021.
Polkadot Price Chart (Daily)

For more market insights, follow Elliott on Twitter.

