
The Nasdaq 100 is witnessing a considerable selloff this Thursday after technology stocks plunged. The Nasdaq 100 is now trading at 11,837.5 as some of the biggest companies in the technology sector are tanking. Stocks like Apple and Tesla are among those being pounded by sellers. Tesla is down for the 3rd straight day, falling 7.66% on the day currently as exhausted bulls start to exit the stock. Apple has followed up yesterday’s huge bearish engulfing pattern with a 6.57% drop on the day. Amazon, Nvidia and Microsoft stocks are not faring any better, as they are also down by 4.72%, 8.82% and 5.52% respectively.
Today’s drop in the tech index has wiped off nearly $600billion from the valuation of the Nasdaq 100, as it drops almost 4.7% at the time of writing. The tech index component of the Nasdaq 100 has been one of the primary beneficiaries of the coronavirus pandemic, and companies and individuals scrambled to deploy tech products to adapt to the enforced quarantines and lockdowns. The tech sectoral index rose as much as 30% in Q2 2020 and is still up around 32% for the year despite today’s selloff.
Technical Outlook for Nasdaq 100
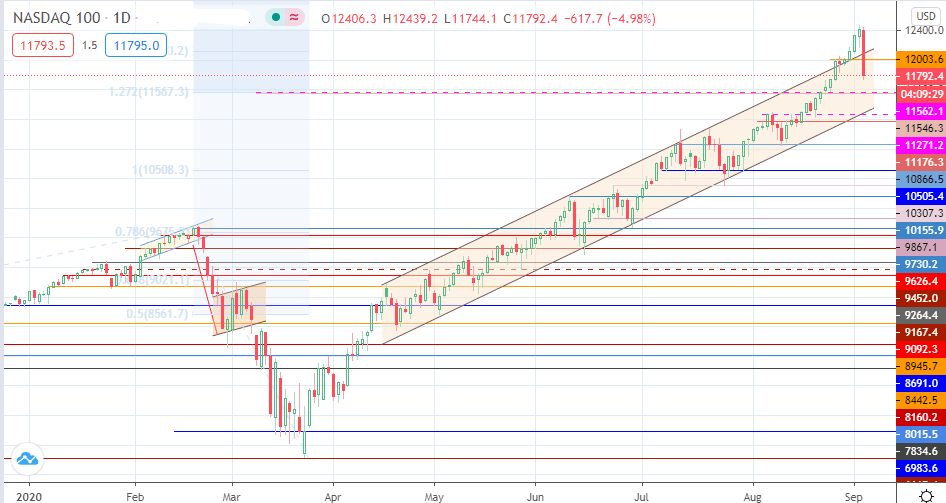
Today’s selloff, which I had suggested was in the offing in a recent analysis piece, has taken the index below the 12003.6 support level. A follow-through selloff is required to send the Nasdaq 100 towards the 11562.1 support, which is the only barrier standing between sellers and the channel’s trend line. Further descent to 11546.3 follows the breakdown of this level as well as the channel’s trend line. This also brings in 11176.3 and 10866.5 into the picture as potential targets.
On the flip side, the arrest of the decline at 11562.1 or the channel’s lower border allows for a bounce and retest of recently broken support areas at 12003.6. Only an ascent beyond 12467.8 (yesterday’s all-time high) re-establishes the recovery.
Don’t miss a beat! Follow us on Telegram and Twitter.
Nasdaq 100 Daily Chart
More content
- Download our latest quarterly market outlook for our longer-term trade ideas.
- Follow Eno on Twitter.
- Do you enjoy reading our updates? Become a member today and access all restricted content. It is free to join.