
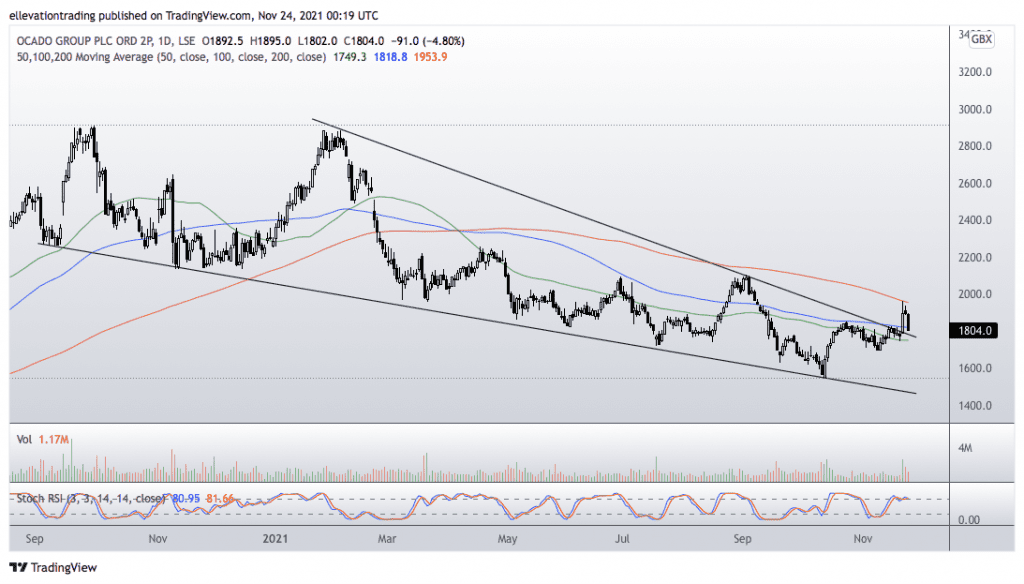
The Ocado share price suffered heavy losses on Tuesday after failing to breach a key technical resistance level. Ocado Group Plc (LON: OCDO) finished the day at 1,804p (-4.80%) and almost 8% below Friday’s closing price.
The share price received a surprise boost last week when rumours swirled that Marks and Spencers are considering buying out Ocado’s UK business (of which it owns 50%). As a result, the price popped almost 10% intraday on Friday before paring the gains to 6%. However, in the two days following, the price has been in free-fall. Subsequently, the price action has undone much of the constructive work of last week, which may signal a resumption of the downtrend.
OCDO Price Forecast
The daily chart shows OCDO broke above a long term downtrend at 1,795p on Friday. The resulting uplift also cleared the 100-Day Moving Average (DMA) at 1,818.8p. However, the rally stalled at the significant 200 DMA at 1953.9, the biggest obstacle for the bulls.
The reversal from the 200 DMA forced OCDO below the 100-Day and towards a test of the trend resistance-turned-support, now at 1,790p. If the price slides below 1,790p, I expect the selling to accelerate, targeting the November 8th low of 1,699p.
If the Ocado share price holds above the trend, it may turn higher to retest the 200-DMA. However, as long as the price remains below the long-term indicator, the path of least resistance is lower. Therefore, the outlook remains bearish below 1953.9p, whereas a close above that level favours the bulls.
Ocado Share Price Chart
For more market insights, follow Elliott on Twitter.