
The NZDUSD pair is up by more than 0.20% as traders wait for the FOMC decision and New Zealand GDP data. It is trading at 0.6727, which is the highest it has been since Wednesday last week.
The New Zealand statistics office will release the official second quarter GDP later today. Analysts polled by Bloomberg expect the data to show that the country’s economy contracted by more than 12.8% in the quarter.
The median estimate by analysts polled by Reuters expect to fall by above 12.3%. This will be after the economy contracted by more than 1.6% in the first quarter. That means that the country will be in the first technical recession since the previous global economic crisis.
The New Zealand GDP data will come a day after the bureau released the country’s trade numbers. The data showed that imports in the quarter fell sharply as the country implemented strict lockdown measures. As a result, the current account surplus of $0.5 billion. That is after export of goods fell by $0.8 billion while imports declined by more than $3.2 billion. Meanwhile, exports of services increased to $3.9 billion while import of services fell to $4 billion, the smallest increase since 2014.
The NZDUSD will also react to the Federal Reserve interest rate decision. Analysts polled by CNBC expect that the bank will leave interest rates unchanged until 2023. They also expect the bank to sound a bit dovish.
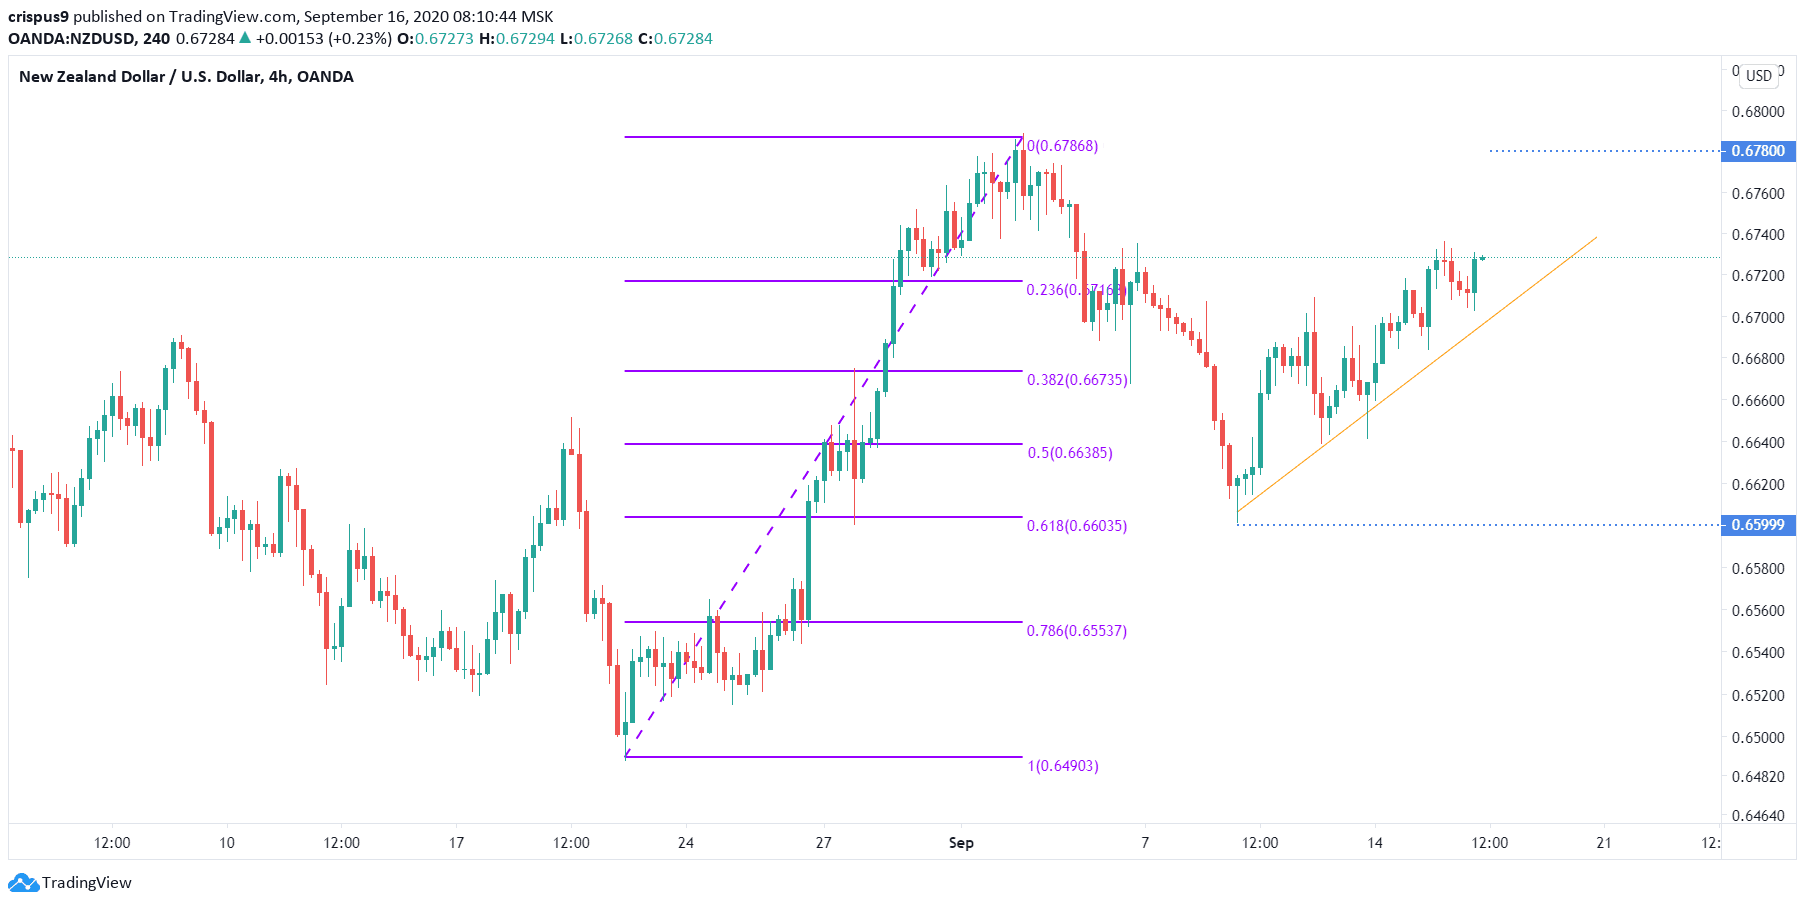
NZDUSD technical outlook
The NZDUSD is trading at 0.6727, which is higher than last week’s low of 0.6600. On the four-hour chart, the price has just moved above the 23.6% Fibonacci retracement level. This retracement is drawn by connecting the highest point on 2nd September and the lowest point on August 20th. The price is also above the 50-day and 100-day exponential moving averages. It is also above the ascending trendline that is shown in orange.
Therefore, it seems like bulls are in control, which will push the price higher, potentially to 0.6780, which is the highest point this month. On the flip side, a move below 0.6700 will invalidate this trend.
Don’t miss a beat! Follow us on Telegram and Twitter.
NZD/USD technical chart
More content
- Download our latest quarterly market outlook for our longer-term trade ideas.
- Follow Crispus on Twitter.
- Do you enjoy reading our updates? Become a member today and access all restricted content. It is free to join.