The Nasdaq 100 index futures are up this morning as traders aim to continue recovering from the 7-week low at 11485. The 1.41% uptick points to a higher open for the index as traders slowly digest the Non-Farm Payrolls report.
The NFP showed no change in the unemployment rate at 3.6%, which disappointed analysts who predicted a drop to 3.5%. Also, despite adding more jobs than expected (390K versus a consensus of 325K), the figure represented a slowing of the employment market as it fell short of April’s upward revision of 436K jobs.
The Nasdaq 100 index is reacting positively to the numbers, which included a stagnation of wage inflation at 0.3% even when analysts had predicted a rise to 0.4%. The numbers could pave the way for a slowing of rate price hikes, even as recent consumer price index numbers appear to show that consumer inflation may have peaked.
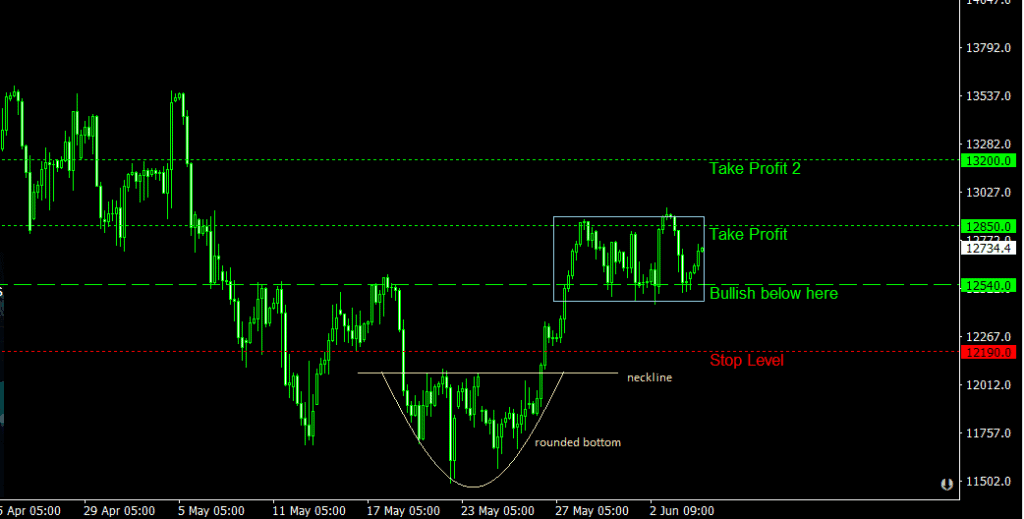
The 4-hour Chart shows that the recent recovery seen from May 27 to May 30 comes from the break of the rounded bottom pattern. After completing the measured move from the rounded bottom, the price action has entered into a rectangle consolidation range.
The expectation is for the evolving rectangle pattern to result in the price continuing in the direction of the prior trend. With the recent minor trend being to the upside, a near-term bullish break of the range validates the indicator’s signal.
Nasdaq 100 Index Outlook
The Nasdaq 100 bottomed out on May 20, and per the InvestingCube S&R levels indicator, the Nasdaq 100 will maintain a short-term bullish uptrend as long as the index trades above 12190. The indicator has advocated being bullish between 12190 and 12540 to obtain an excellent risk to reward ratio. The first take profit level is the 12850, a level just shy of last week’s high of 12952. The second resistance level and take profit level is at 13200. The price would need to trade above last week’s high to reach this second take profit level. Try the indicator today.
Nasdaq 100: 4-Hour Chart