The Nasdaq 100 index took a step back from its recent recovery this Tuesday, falling 1.07%. This follows the 4-day rally in the index that pushed it off its recent lows around 11500. The risk-associated index had dropped by much further, but a slight recovery has pared some of those losses.
In a relatively sparse week in terms of fundamental triggers for price action, the Nasdaq 100 index is looking to continue the recovery after snapping a 7-week losing streak last week. The index is struggling to advance beyond the 12772.9 resistance level, just above last week’s high.
The recent decline in the Nasdaq 100 was prompted by a return to a higher interest rate environment. Fed Governor Christopher Waller is the latest to add his voice to the rate debate, saying he was ready to take rates past “neutral” to combat inflation.
He is also of the view that 50bps rate hikes should be on the table at every FOMC meeting this year, insisting that rates could go “a lot higher” if inflation did not abate. The rhetoric appears to have spooked traders on the Nasdaq 100 index slightly, leading to the stall of the advance.
Nasdaq 100 Index Outlook
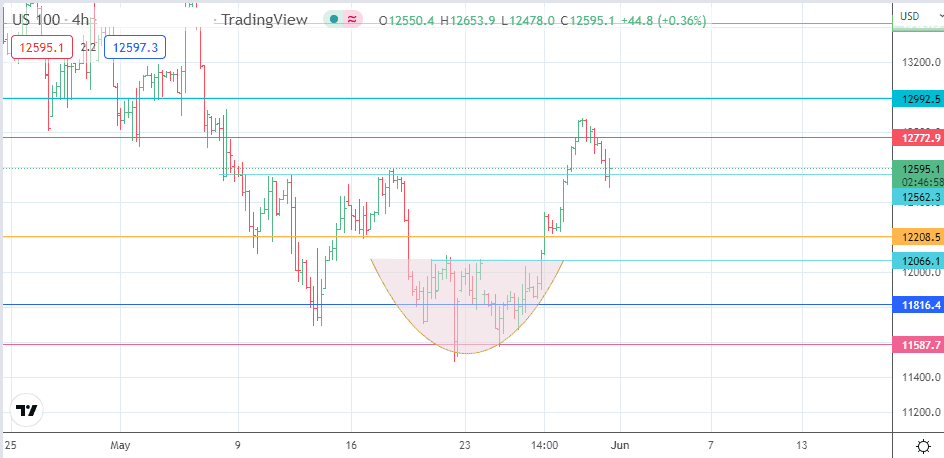
The rounded bottom on the daily chart cleared the neckline at 12066.1, broke through 12208.5 and touched off the 12772.9 resistance, completing the pattern’s measured move. If a closing penetration below this completion point follows the intraday decline, this would invalidate Monday’s violation of this price point.
The bulls must uncap this resistance to open the door toward the 12992.5 resistance (15 March low). Above this level, additional upside targets are seen at the 13421.5 barrier (14 March and 29 April highs), and at 13764.7 (10 March and 22 April highs).
On the flip side, an extension of the intraday decline targets 12208.5 initially. Below this level, the former neckline at 12066.1 becomes the immediate target to the south. If additional price deterioration occurs, 11816.4 and 11587.7 form additional southbound targets.
US100: Daily Chart