The Nasdaq 100 index has had a positive week even after the relatively challenging earnings season. The index rose to a high of $12,600, even after the hawkish Federal Reserve interest rate decision. This price is about 14% above the lowest level this year. This performance is in line with that of other leading indices like the Dow Jones and the Russell 2000.
Apple earnings ahead
The Nasdaq 100 index has been in a strong bullish trend in the past few days as the biggest constituent companies published their results. For example, on Tuesday, Microsoft’s earnings and revenue retreated slightly in the second quarter. In the same period, Alphabet’s advertising growth slowed down at the lowest pace since 2020.
Further, on Wednesday, Meta Platforms reported that its revenue and profitability declined for the fiest time ever. The firm attributed this performance to the significant impact of Apple’s iOS upgrade. At the same time, the company said that it was seeing weaker demand as companies navigated the rising consumer inflation.
The next important Nasdaq 100 constituents to publish its results are Apple, Roku, and Zendesk, among others. While earnings have been bad, analysts believe the situation has been better than analysts expected.
The Nasdaq index will next react to the latest US GDP data that will come out on Thursday. Analysts expect the data to show that the economy expanded by 1.5% in the second quarter after contracting in the previous quarter. The GDP data will come out a day after the Federal Reserve continued hiking interest rates this week.
Nasdaq 100 forecast
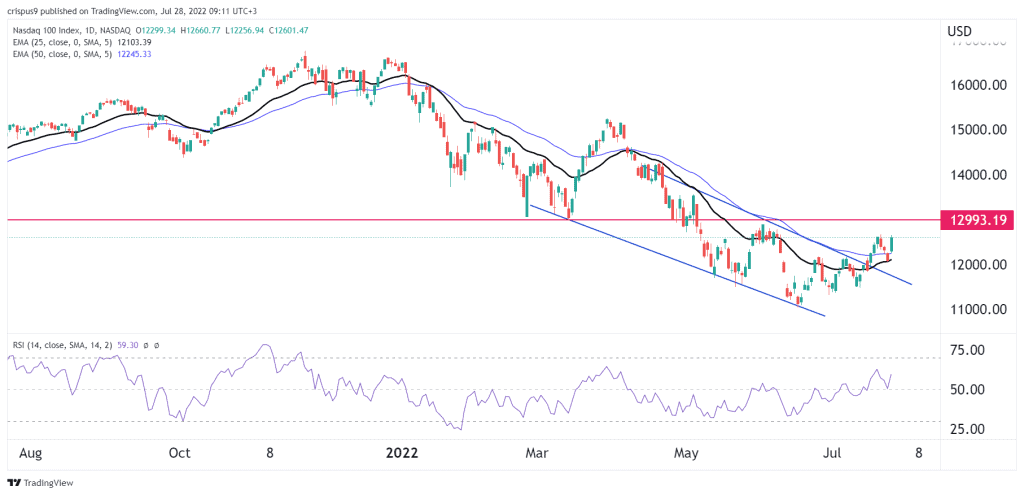
The daily chart shows that the Nasdaq 100 index has been in a strong bullish trend in the past few days. It has managed to move above the upper side of the descending channel, which is shown in blue. Most importantly, it has formed a break and retest pattern, which is usually a bullish signal.
The index has moved above the 25-day and 50-day moving averages, while the Relative Strength Index (RSI) has moved above 50. Therefore, the index will likely continue rising as bulls target the key resistance at $13,000.
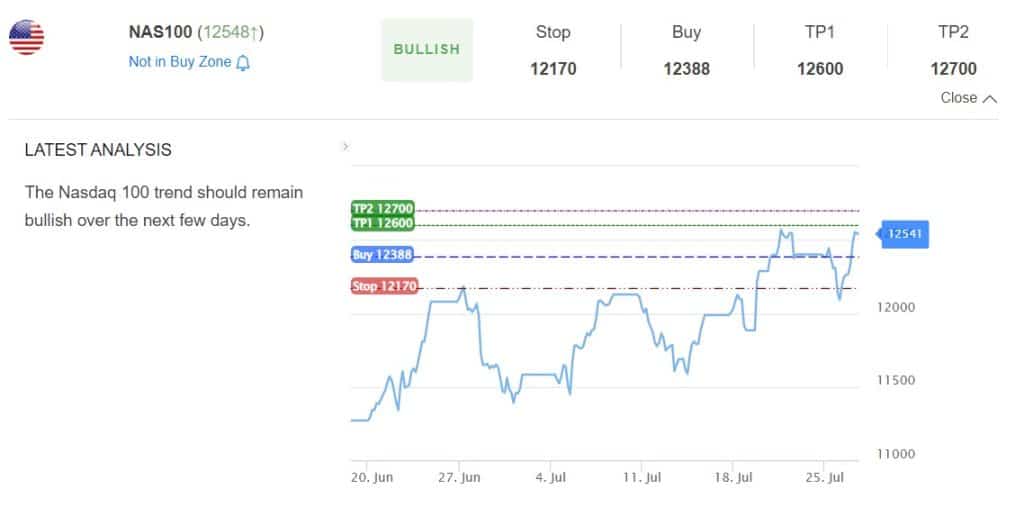
Nasdaq index support and resistance levels
At InvestingCube, we believe in helping traders and investors make better decisions in the market. The S&R indicator is one of the most accurate tools in the industry. It is used by thousands of people every day. The indicator is bullish on the Nasdaq 100 index and expects it to rise to $12,700.