ITV share price woes show no signs of easing. In fact, things may get a lot worse for the UK’s second-favourite broadcaster. After being accepted back into the UK’s Blue-chip FTSE 100 Index in June, ITV plc (LON: ITV) made a 17-month high at 132.55p. However, in what was ‘buy the rumour, sell the fact’ event, this marked the top for 2021, and since then, the ITV share price has shed 15%.
Although the Covid-pandemic has played its part in the decline of ITV, the broadcaster was struggling long before 2020. Despite rallying more than 128% from last years low, at 113p, the share price is still 60% below the 2015 high of 280p.
Of course, in the last 6 years, the competition has been not just heating up but catching up. Streaming services such as Netflix and Amazon have slaughtered legacy TV Networks. The streaming giants have bigger budgets, better infrastructure and better content. Not to mention that ITV has suffered a series of setbacks this year. The furure surrounding Piers Morgans departure from the channel’s popular GMT morning show saw 250,000 viewers switch allegiance to BBC’s breakfast time. Also, the cancellation of ITV’s prime-time Saturday night stalwart, the X-Factor, will prove hard to replace.
Post lockdown Viewing Habits
Another possible headwind for the ITV share price is the end of lockdown. For most of the last year and a half, the UK had few options aside from watching TV. However, after 18 months of sitting on the sofa, people may be TV’d out and decide to spend time outside the house rather than in front of the box. It will be interesting to see how this is reflected in viewing figures over the next few months. Although, It’s hard to imagine a scenario where more people are tuning in. And on that basis, you can make an argument that March may be as good as it gets for a while for ITV shareholders.
Technical Analysis
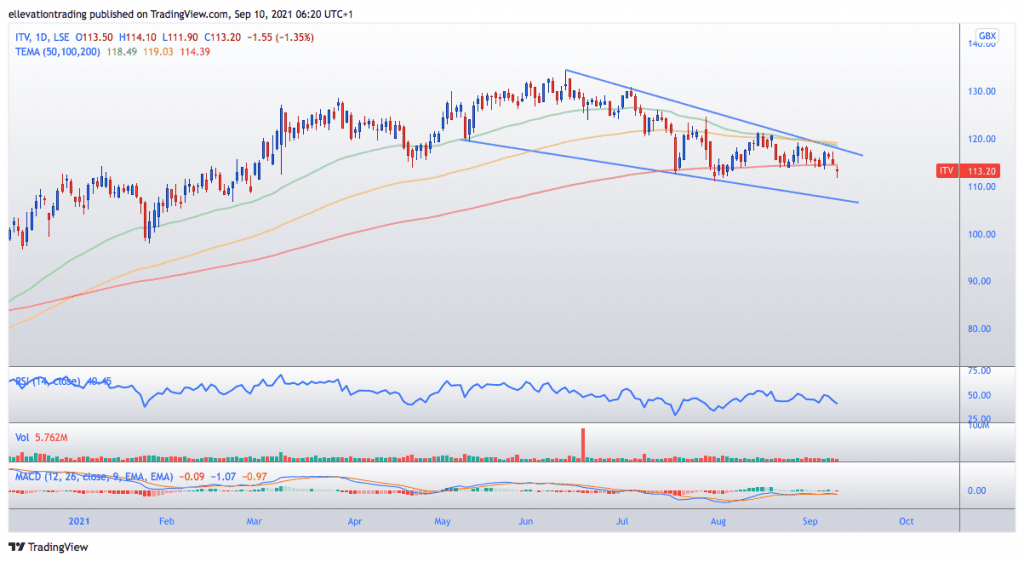
The daily chart shows the ITV share price has been trending lower in a descending wedge pattern since June. Notably, the price has just slipped below the 200-day moving average at 114.39p, which should be considered bearish. Although, in saying that, the share price has managed to recover previous sojourns below the average in recent months.
However, what saved the price before was the lower edge of the descending wedge. The last dip below the 200 DMA reversed from the support of the trend line at 112p. But now, the trend is seen at 107p, around 6% below the last trade. Therefore, I expect the price to drop 6% from here for a test of trend. Furthermore, should the trend give way, an extension to the January low of 98p looks likely.
The bearish outlook remains relevant as long as the ITV share price is in a downtrend. Therefore, if the price clears trend resistance at 117.5p, this view becomes invalid.
ITV Share Price Chart (Daily)
For more market insights, follow Elliott on Twitter.