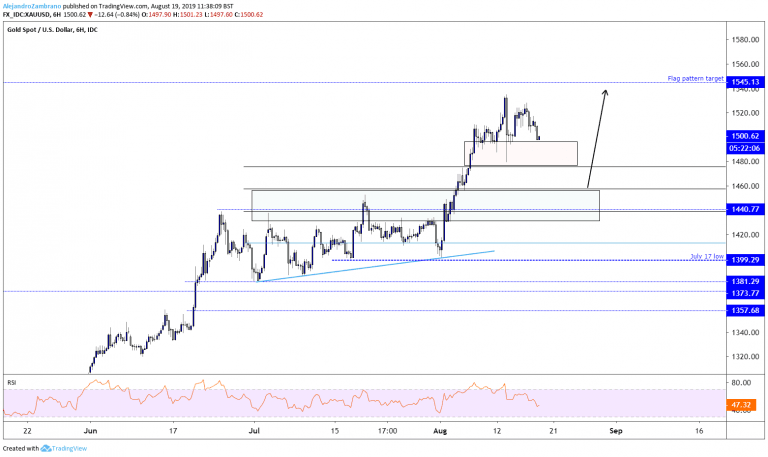
At the time of writing, gold prices were lower as European stock markets traded higher. Gold prices were down by 0.88%, while the DAX index was up by the same amount. The next support level in gold prices is last week’s low of $1480, and the most bullish investors will probably try to buy when the price nears $1480. If the price indeed manages to remain above last week’s low the price might revisit the August high of $1535, followed by a flag pattern target at $1545.
Don’t miss a beat! Follow us on Telegram and Twitter.
If the price fails to hold above the $1480 low, gold prices might find support at the $1457 level, followed by the $1439 level, these two levels are the 50%, and 61.8% correction level of the bull leg that started from the July 1 low of 1380 and ended with the August high at $1353. The multi-week trend will remain bullish as long as the price trades above the July 17 low, so a 50% correction of the rally from the July 1 low will probably be well supported by investors that are looking for a good risk-reward ratio. The multi-week trend is also supported by the world’s biggest central banks cutting interest rates amid a global economic slowdown.Download our latest quarterly market outlook for our longer-term trade ideas.
Do you enjoy reading our updates? Become a member today and access all restricted content. It is free to join.