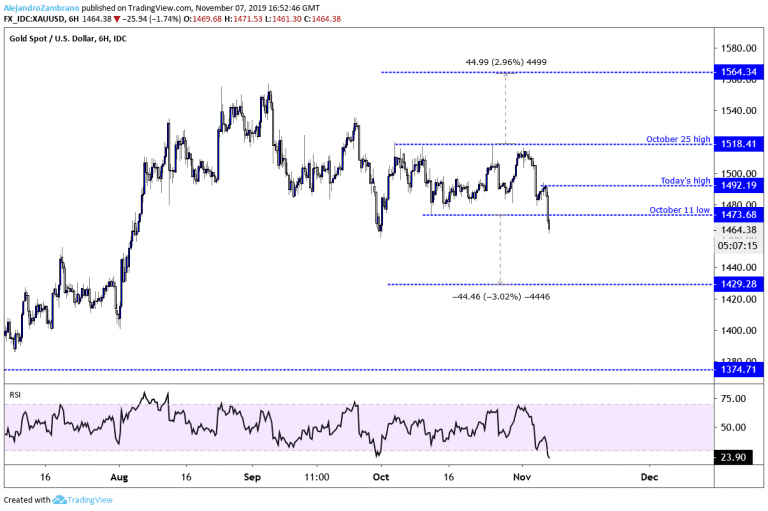
Gold prices (XAUUSD) just slid below their October 11 low of $1473.68, and might now be on their way to the $1429 level per a rectangle pattern. The move lower appears to be triggered by a stronger US Dollar. For more on my dollar outlook read: DXY: The Dollar Might Have Bottomed Out Last Week
As we have been reporting over the last few days, gold prices were trading sideways between the October 11 low of $1473.68, and the October 25 high of $1518.41. The tight range resulted in a rectangle pattern, and today’s break to the lower limit at $1473.68, suggests that the price might slide by $44.73, which is the same amount as the difference between the low and high point of the pattern.
Don’t miss a beat! Follow us on Telegram and Twitter.
As the London trading session is about to end we might see stabilization in the price as liquidity dries up. However, the pattern will remain active, and the trend will continue downwards as long as gold prices do not trade above today’s high of $1492.19. If gold prices turn higher then I think traders will treat the October 11 low at $1473.68 as resistance.More content
- Download our latest quarterly market outlook for our longer-term trade ideas.
- Follow Alejandro on Twitter.
- Do you enjoy reading our updates? Become a member today and access all restricted content. It is free to join.