Gold price looks to have formed a temporary bottom. It made a new lower low last week and then bounced after a bullish divergence with the RSI. On top of that, the price of gold shows a falling wedge on the lower timeframes, a pattern that typically leads to reversals.
The price of gold moved in an uncorrelated manner with the dollar and the rest of the financial markets. While the lower dollar is the theme so far in the trading year, gold kept moving lower as flows poured out of the yellow metal. Many reasons may be behind the gold underperformance, such as profit-taking after last year’s new all-time high or portfolio managers switching from gold to digital assets. Ultimately, some bullish dollar voices say that the low level on the price of gold reflects the upcoming strength in the dollar, as gold tends to lead the market.
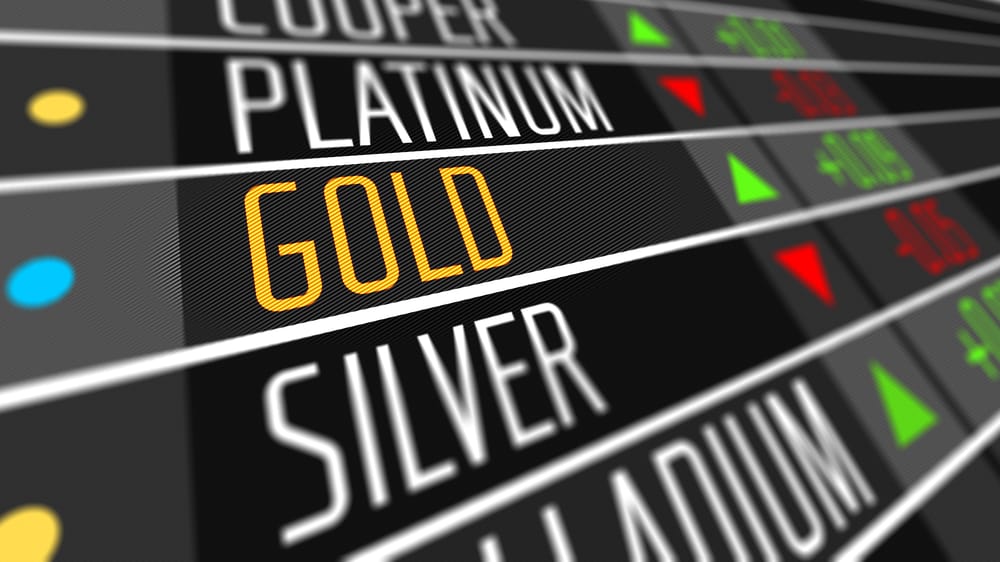
Gold Price Technical Analysis
The technical picture shows the falling wedge pattern and how the price of gold diverged from the RSI during the last leg lower. Bulls may focus now on a break of the upper edge of the pattern, a break that may bring more strength. To trade it, bulls should wait for the price to break above $1,820, place a stop at last week’s lows and target a risk-reward ratio of 1:3.
Don’t miss a beat! Follow us on Telegram and Twitter.
Gold Price Forecast

More content
- Download our latest quarterly market outlook for our longer-term trade ideas.
- Follow Mircea on Twitter.
- Do you enjoy reading our updates? Become a member today and access all restricted content. It is free to join.